
When the first estimate for Gross Domestic Product (GDP) in the second quarter of this year (2Q14) came out, there was reason to cheer. A solid gain of 4.0% seemed to really shake off the fear cause by the figure for 1Q14, revised up to -2.1%. There wasn’t a new recession after all, and growth is back to being robust. Right?
It’s OK, we’re among friends. Your skepticism is justified. The main reason for the fall in 1Q14 was a big drop in health care expenditures, partly due to a revised way of calculating them. The problem is the way we gather this magic figure called GDP, a supposed measure of the total size of the economy. Just before the figure for 2Q14 came out a new measure of the economy, Gross Output (GO), was introduced by the Bureau of Economic Analysis (BEA). It illustrates the problems with GDP, especially as we all focus on jobs as the real sign of economic health.

How healthy is it?
There are many reasons why new tools are needed to watch the economy, as we’ve discussed before. When everything is cruising along at steady state in a healthy quiescent market we can easily compare one quarter to the other and be done with it. But we all know that’s not the case. The mix of jobs is changing rapidly at the same time more goods and services are being brought from abroad.
Enter the new measure of the economy, Gross Output. The difference is as simple as the formulas for both as a series of components of the economy which can all be measured:
GDP = C + I + G + (E-M)
GO = GDP + II
| ID | Name | Definition | 4Q14 (T$) |
| C | Consumer Expenditures | Consumer spending on goods and services | 11.7 |
| I | Private Investment | Purchase of fixed assets by companies | 2.7 |
| G | Government | Goods and Services bought by Governments | 3.2 |
| (E-M) | Exports – Imports | Net trade balance | -0.5 |
| II | Intermediate Inputs | Goods and Services purchase before final production | 13.0 |
What’s so magical about the inclusion of “Intermediate Inputs”? These are raw materials and semi-finished goods that go into final production of something useful. Since so much is imported and exported before becoming a final product, the difference is very important. GO also accounts for inventory increases in a much more comprehensive way.
GO does double-count many things on their way to being finished products, but it’s overall a better indicator of the health of jobs, given that people are employed in many things along the way to becoming consumer goods. Here is a graph of GO on the left and GDP on the right since 2005, as far as the BEA went to back-calculate this new number:
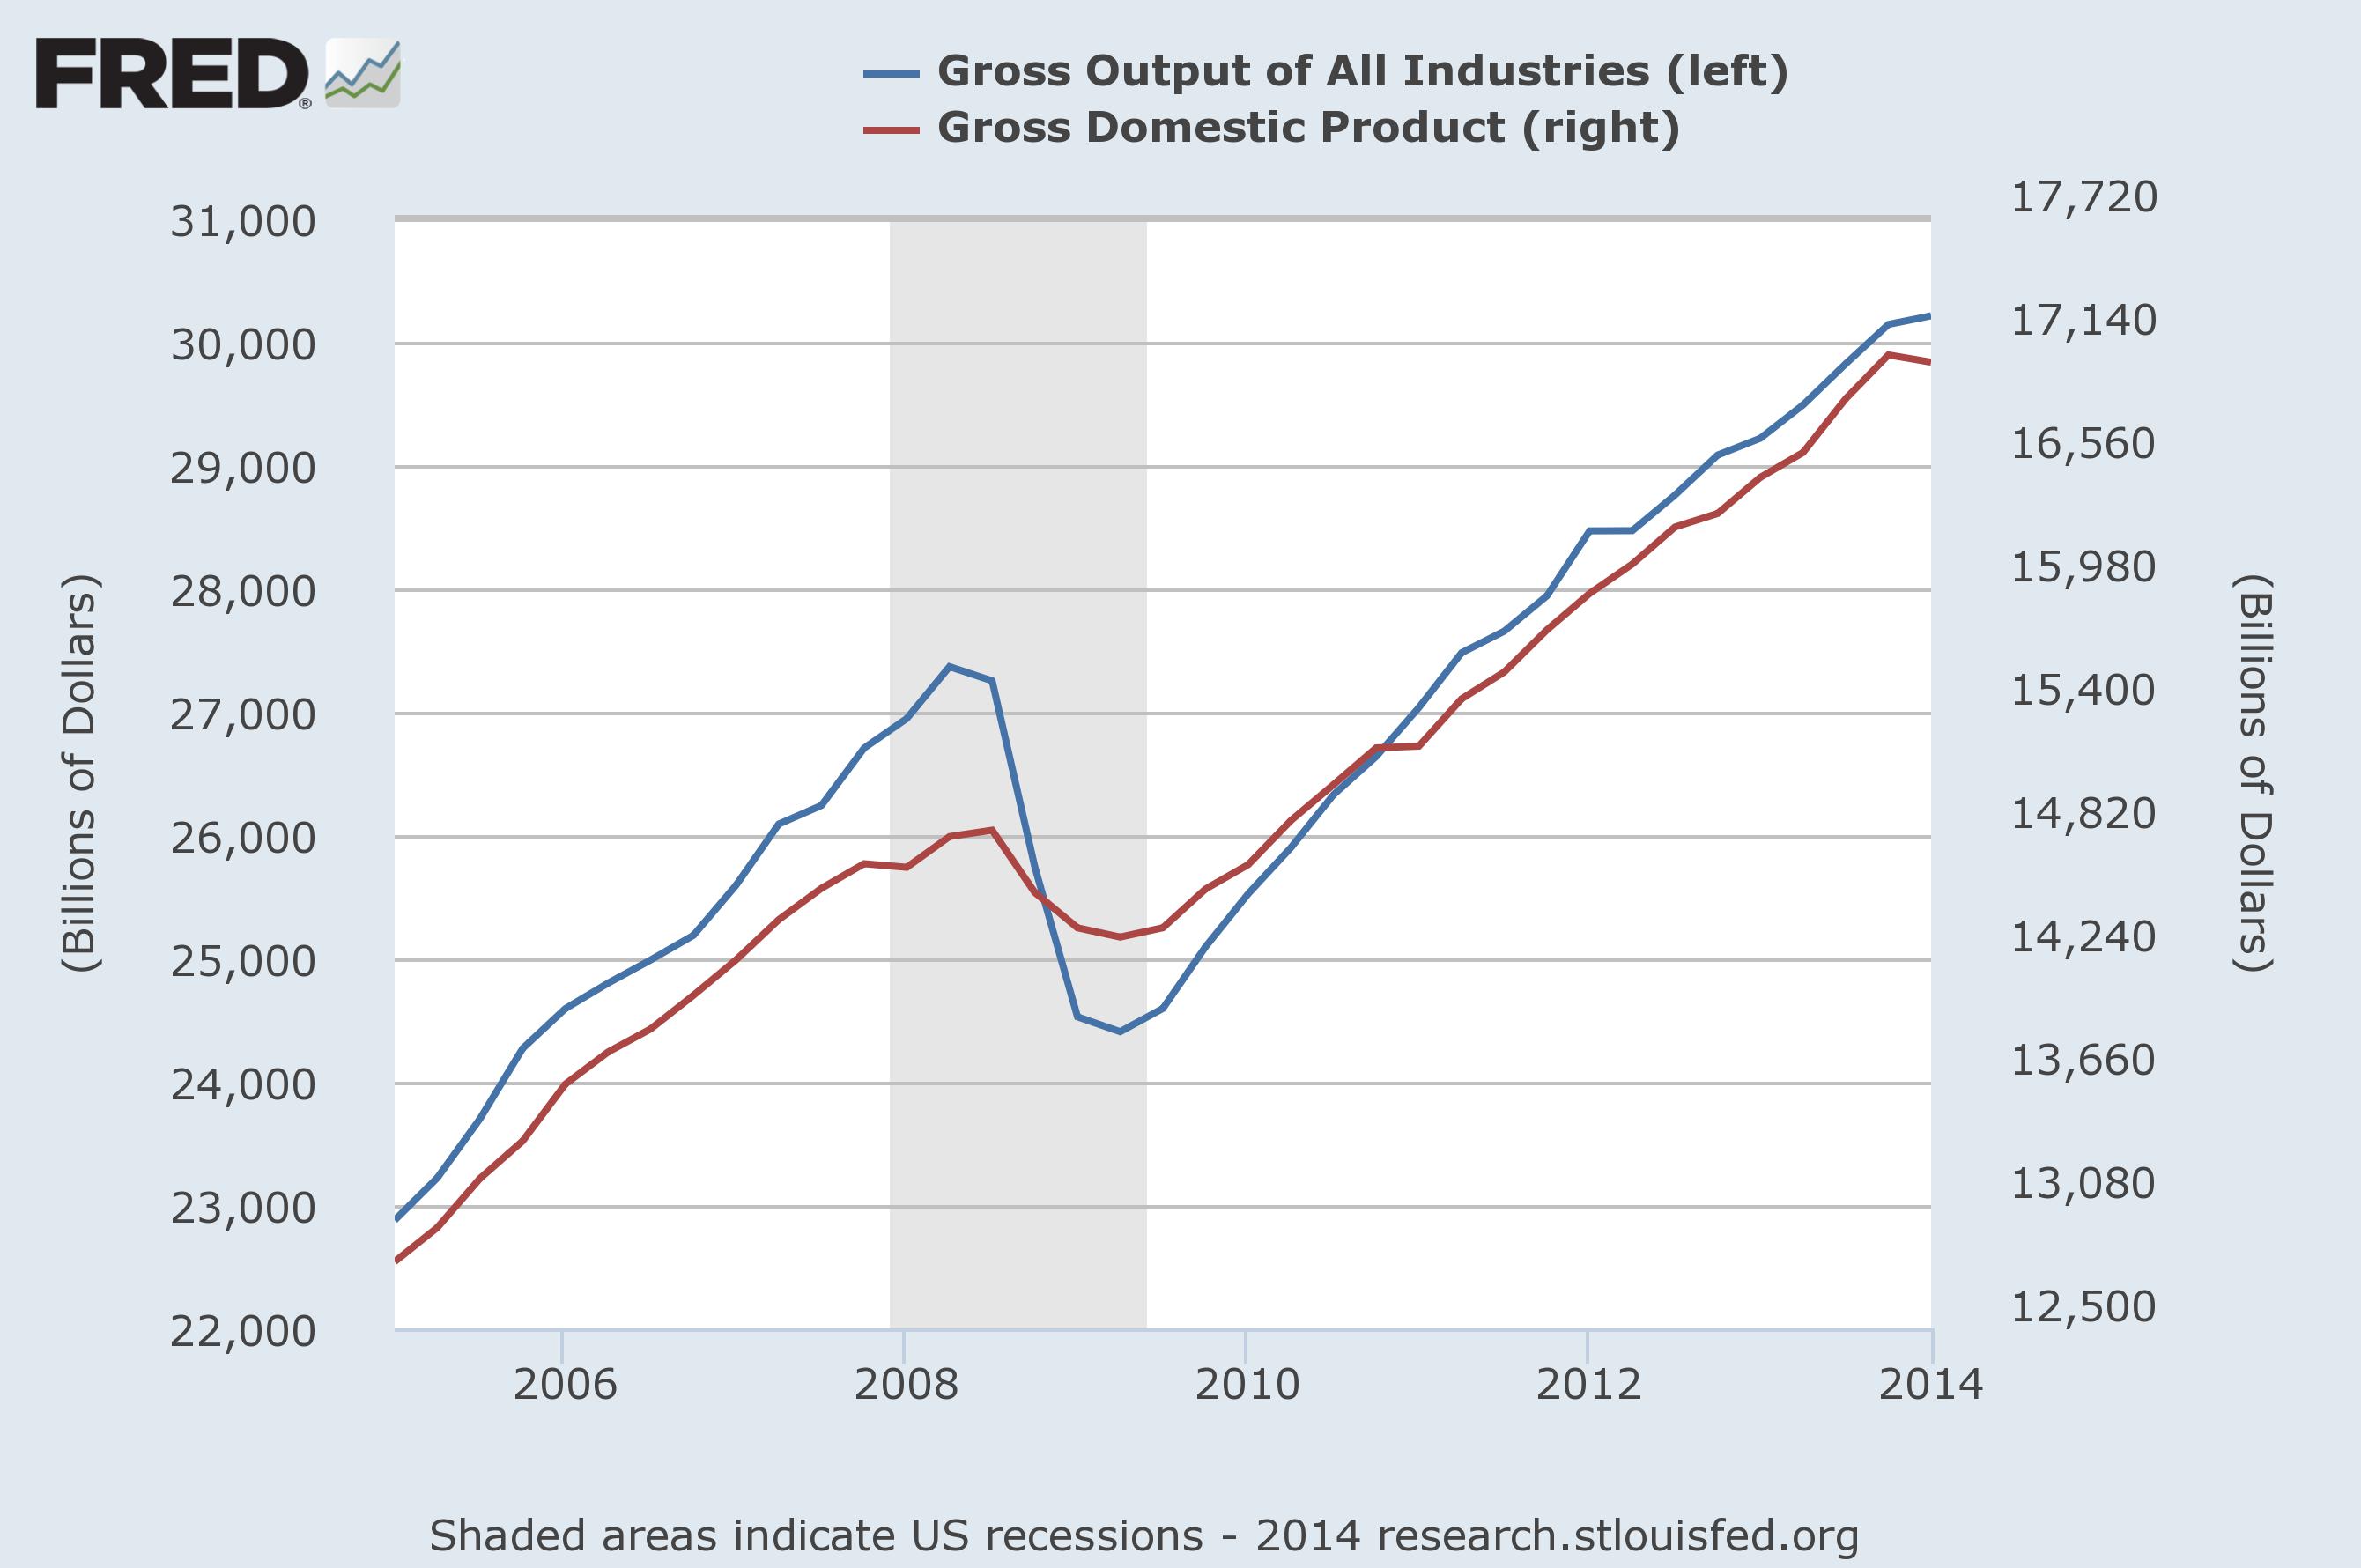
You can see that the official recession of 2008 hit a bit later but much harder on GO than it did on GDP. There is also much less noise in GO, and the downturn in 1Q14 doesn’t show up at all. That happens in part because where Consumer Expenditures are around 68% of GDP, they account for only 39% of GO. A cutback on health care expenses, which most of us would agree is a good thing, doesn’t show up in GO as a bad thing.

It could be worse. A lot worse.
Is the GDP figure really so broken that it needs to be replaced by GO? Not at all. GDP is still a good measure of the overall size and value of the economy. But GO is a good supplement to understand the strange twists and turns that GDP is taking these days as the economy changes. It’s also a much better indicator of job growth because it takes into account all the steps of producing something of value, each of which employs people.
How useful GO is to measure things is still not clear, but it’s good to have it around. We can see that it more accurately shows why 10M jobs were lost between 2008-2010, and why recent bumps in GDP didn’t result in big changes in job growth. These are both useful as we focus on job creation as the only real measure of economic progress.
It also makes it possible to finally make one last transformation that has never quite worked before:
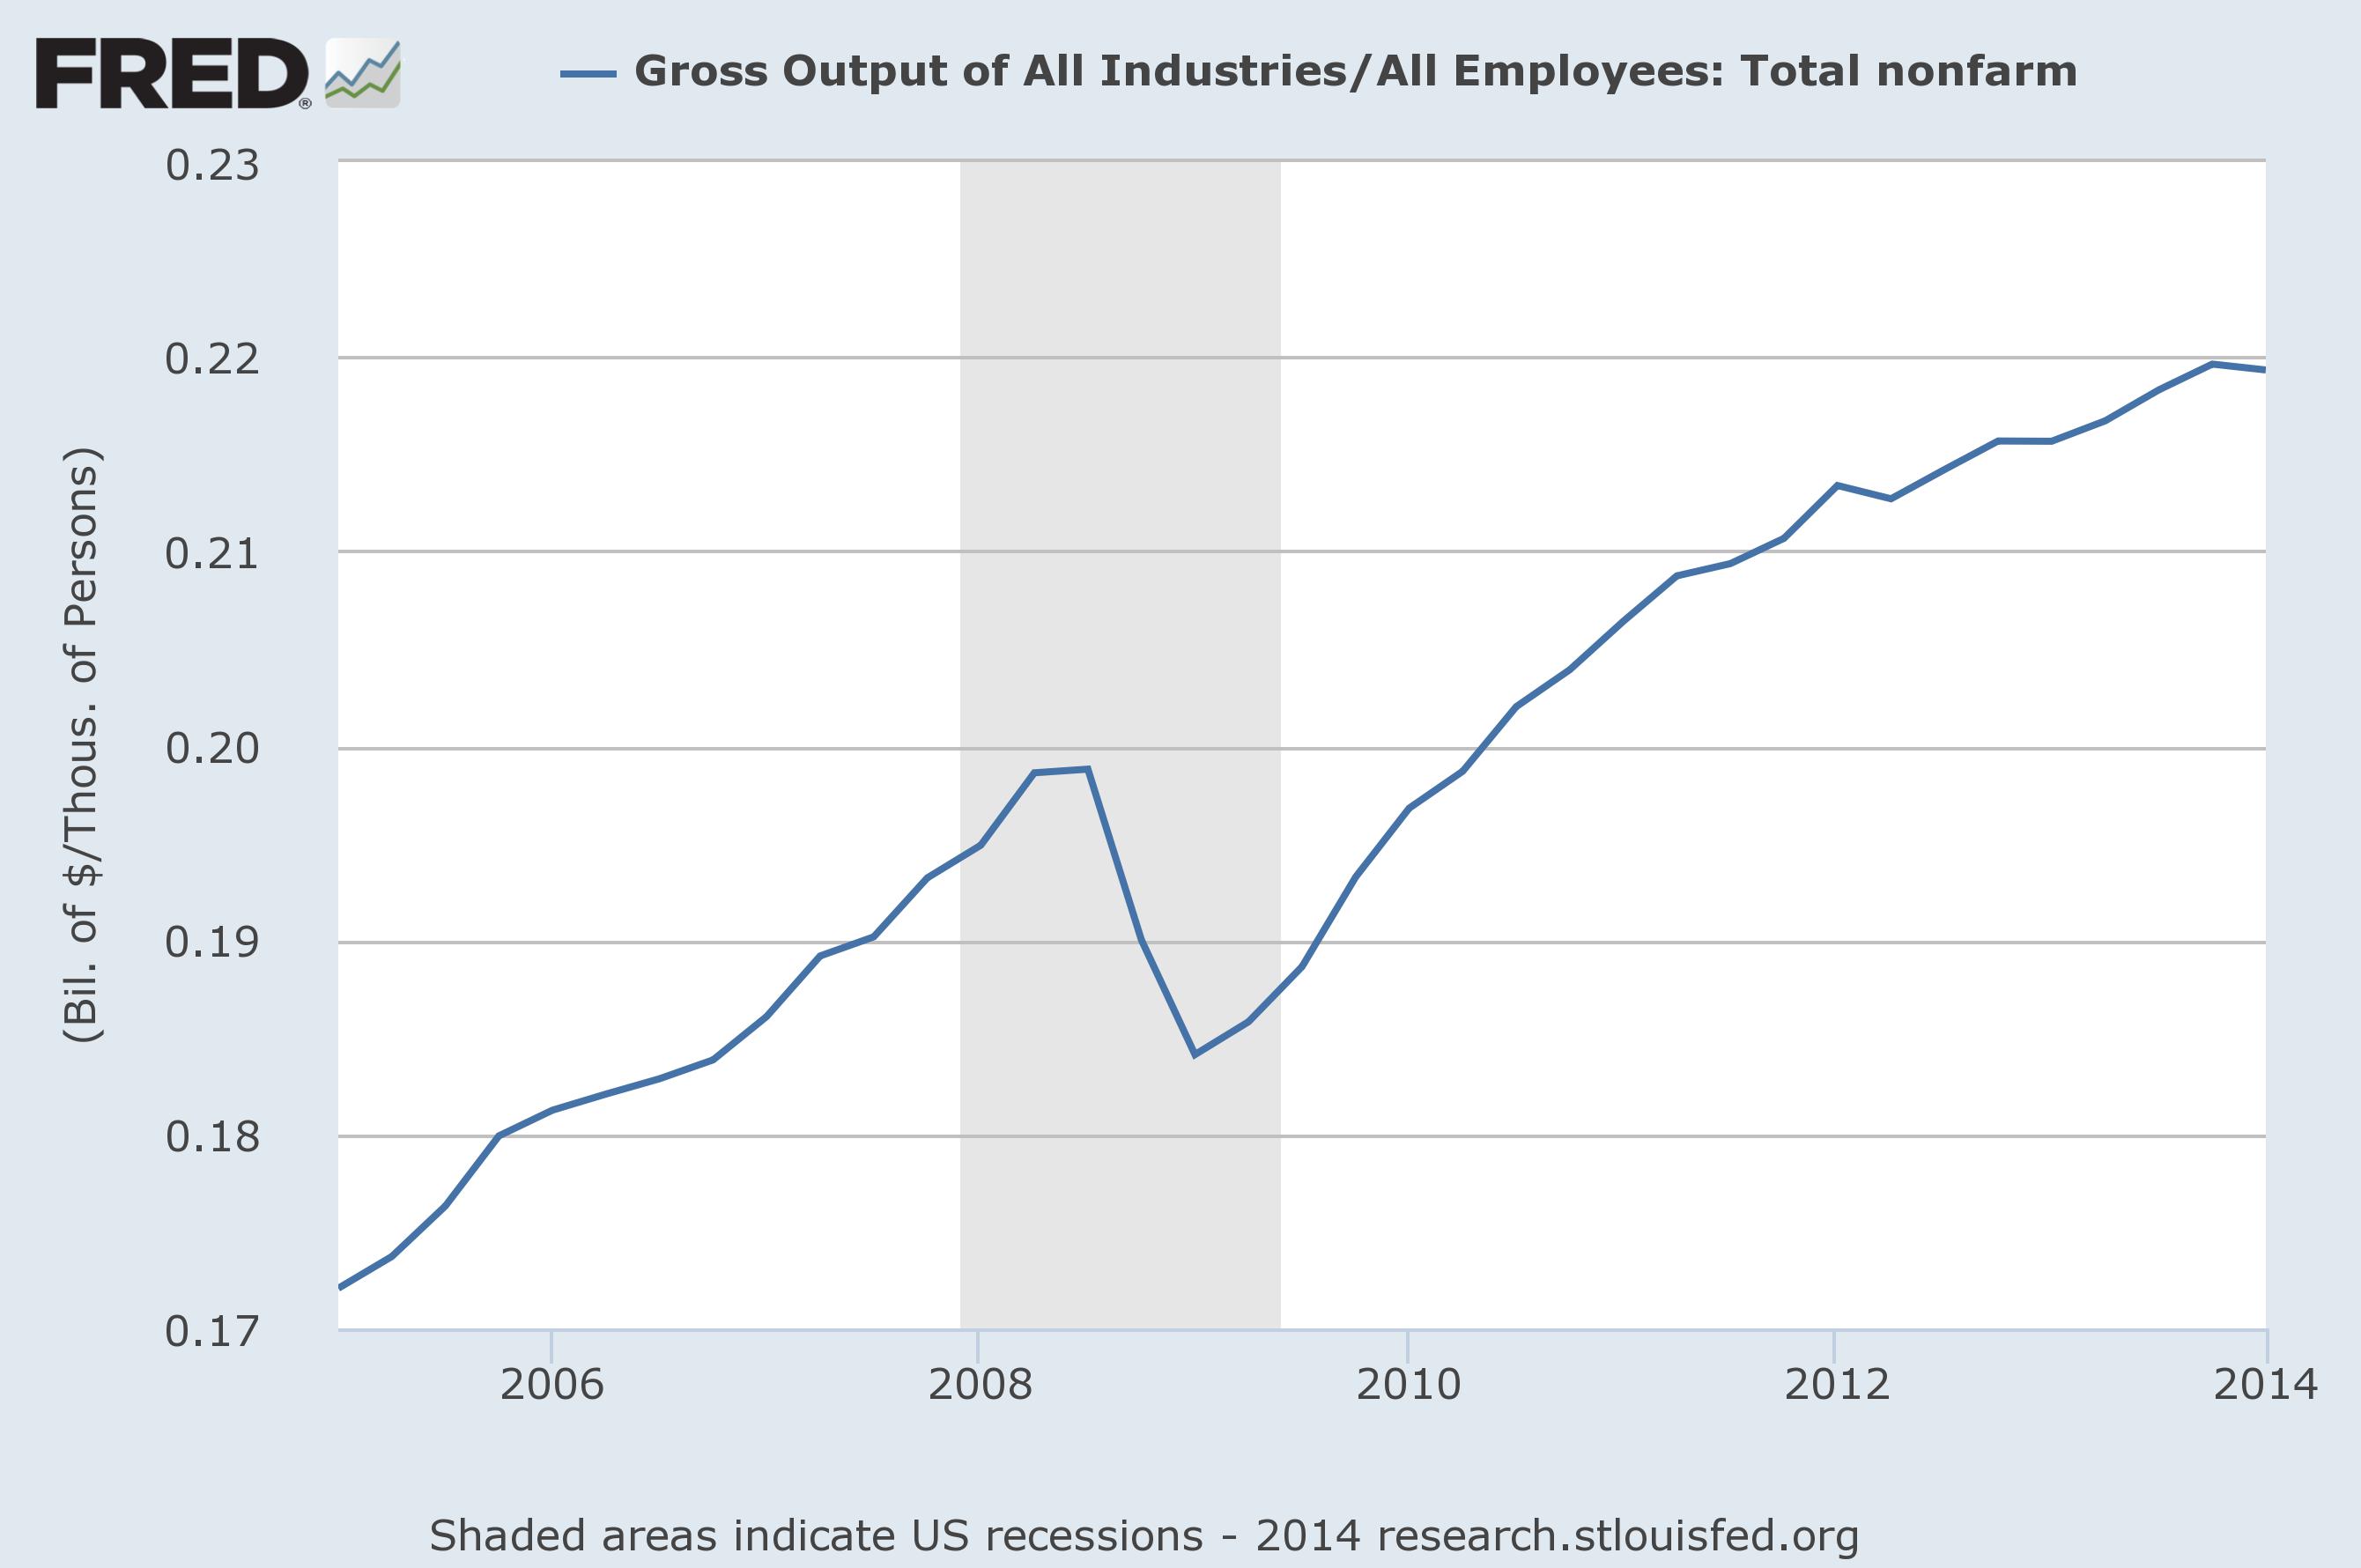
This is a graph of total productivity, or GO divided by the working population. You can see that the output per employee peaked around $200k annually before dropping back during the official recession. This figure makes a lot more sense than what we’ve tried to push together before. More about that later.
What does it all mean? GDP has its limits, and that’s OK. One number probably can’t measure everything in a rapidly changing economy, so we shouldn’t expect it to. That’s where GO comes in, and it’s a useful addition to the toolbox.

This is fascinating but I really don’t know what it means. If you can figure the total size of the economy as two very different numbers which one do you believe and why? I didn’t know so much was left out of GDP but we have relied on it for everything. You look at it a different way and consumer spending is suddenly much less important? There is a lot here and I can’t get my head around it. I’m sorry, this is much bigger than you make it out to be.
GDP is a measure of finished goods, which is to say the net output of the economy. GO is a measure of the total activity it takes to make those goods.
It is a big deal, and the gap between them is larger than I was led to believe when this was a theoretical discussion. I’ve always known that GDP wasn’t a good measure to compare for jobs, which is why I haven’t really tried to link the two – other than repeating a correlation between GDP growth and job growth that someone else came up with (and appears to not work well lately – now I know why!).
Yes, there is a lot more to say here. The productivity figure I threw in at the end is worth a lot more thought. It shows that it dipped substantially before and during the big job loss, which is to say there was a reason companies were shedding workers. There’s a lot of meat in that which is hard to digest all at once. I’m thinking about it.
I also find this very confusing. What is “output” and how do you measure it? There is a big difference between GDP and GO the way you show it. It makes a big difference.
See above. 🙂 GDP is output, and GO is the total activity needed to make that output.