
The Minnesota state budget forecast came out with more bad news – a deficit of $1.1B for the biennium (2 year) cycle of 2014-2015. How can we have these deficits year after year?
The answer is a short and simple one: it’s actually worse than what they are telling us. But a new DFL controlled legislature will be able to work with Governor Dayton to take care of it, once and for all, without an awful lot of pain. The longer answer is that we can expect even more fundamental reform in the works.
Let’s start with the forecast. The office of Management & Budget is required to make budget forecasts so that the Legislature can fulfill its constitutional obligation to prepare a balanced budget. But they are constrained by a 2002 law which forbids them from using inflation in calculating projected expenses in coming years – while still counting inflation for revenue collections. The official forecast is thus heavily tilted to show that everything is rosy. Knowing that this is ridiculous, the official projects do include a full accounting for inflation in the footnotes, so below are the numbers they are not allowed to tell us – but I can:
| 2014 | 2015 | 2016 | 2017 | |
| Official | -$815 | -$258 | $29 | $234 |
| Inflation | -$276 | -$614 | -$968 | -$1,393 |
| Total | -$1,091 | -$872 | -$939 | -$1,159 |
| Biennium | -$1,963 | -$2,098 |
As you can see, there is a structural deficit of roughly $2B every biennium, about a billion bucks a year. That is what the new Legislature has inherited.
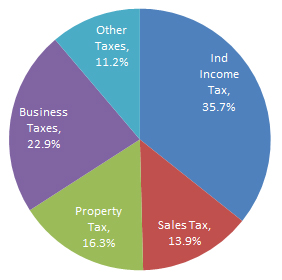 There is good news, however, if you look into it further. The Department of Revenue publishes a “Tax Incidence Study” (2011 here in pdf) to show just who pays the taxes in the state by income level. State and local governments are all constrained by the same laws, so it only makes sense to look at the two together. Business taxes can be assigned to each income level based on what people spend in stores et cetera, so all taxes are distributed to individuals in this analysis, from the sources shown in this diagram.
These taxes fall on different sectors of the population by income, so the meat of the study is who winds up paying what. Dividing families into 10 equal ranges of 263,000 households gives us this chart of the net effective rate paid by each group, here listed by the lowest annual income in k$/yr for that group:
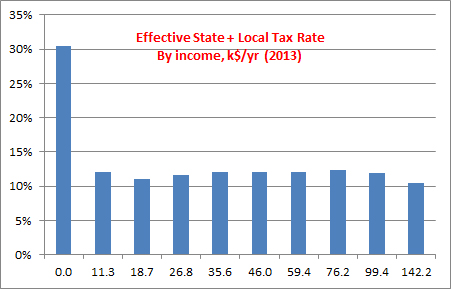
Two features are very prominent. The first is that the poorest among us, earning less than $11.3k per year, appear to pay an extremely high rate. Some of this is the result of policies that are truly regressive, such as taxing apartments higher than houses, and some of it is because many people in this category are “temporarily poor” such as those who go back to school – they might spend at a much higher rate than their income.
The most important feature, however, is that the rate is very flat – 12.1% to 12.3% – over a broad income range, before falling off to 10.4% for people who make more than $142k per year.
Simply raising the highest two tenths of the population up to a rate of 12.3% – the rate paid by the 8th highest group, raises $1.7B every year – more than closing the budget gap. This can be accomplished by a small increase in the income tax rate at the high end.
That is almost certainly what Governor Dayton will propose, at least as an opening plan. We still need about $1.1B left to pay back the “K-12 Shift” – a gimmick whereby the state delayed payments, effectively borrowing from every school district in the state to make the budget look better. And there is another $1.7B in possible losses should the Federal government go over the “Fiscal Cliff” on 1 January. The hole we are in is big and it could indeed become much bigger.
More interesting, however, is how Governor Dayton has been talking about more fundamental reform in how we tax and spend in state and local governments. We do not have any details yet, but there is little doubt that there is room for change. A buy-down of property taxes through better funding of counties may be a start – given that they are both the local arm of the state and the local unit of government to rural areas. Unfunded mandates from the state fall heavily on counties, and with the tax increase outlined above to a flat 12.1% – 12.3% across all incomes would give as much as $700M to think about a buy-down of property taxes after solving the structural problems.
The dour forecast may actually work in favor of reform to the extent that it dampens demand from groups that have been waiting for the DFL to control government again, especially cities hoping for more Local Government Aid (LGA). Cities are generally used to not having LGA, essentially not believing in Santa given that they haven’t seen him in a while. There is always a chance they may be patient. Governor Dayton will have to work to make that happen, however.
All in all, the situation is dire – but highly correctable with some sensible leadership. Minnesota is in bad shape, but it can be solved simply by making tax collection more uniform across all incomes.
One last note – while the net rate is 12.1% of defined income, it is worth noting that the definition of “income” does not include many sources, particularly business income. The total Gross State Product (GSP) is 32% bigger than the taxable income identified, so the net rate for all state and local taxes combined is only 9.2% of GSP – far lower than the roughly 10% and more it was in the 1990s. Every government service we enjoy in this state, from police to paramedics to schools to parks to local roads, costs us 9 cents of every dollar in the state economy. That seems like one Hell of a bargain, if you ask me.

Footnote: The 2002 state law that prohibits the inclusion of inflation in the spending forecasts for Minnesota, but requires it in revenue forecasts, has an interesting history. Roger Moe and Tim Pawlenty were the Senate Majority and Minority leaders, respectively, and were about to run against each other for Governor. They rammed this law through in order to make the state budget look better, benefiting both of them. In short, Tim Pawlenty was screwing with the budget even before he became Governor.
Oh, and in 2002 I voted Independence Party.
Brilliant! Best I’ve seen yet on the budget. Thanks for putting this together.
Thank you. There’s a lot more to say, but this got long as it is.
Thank you, this explains an awful lot.
Thank you! Long time no see!
Would you put your inflationary increase into the K-12 education budget and health and human services. I saw in the forecast that those 2 areas have forecast spending of $1.5 billion over the current projected biennium spending. I think the forecast for the 2 areas are formula driven.
As a conservative I would have presented an analysis of historical actual revenue as percent of MN gdp and historical actual spending as a percent of gdp.
I will get together the spending / revenue vs GSP. That will take me some time and effort, but you are right that we should do it.
Yes, K-12 and HHS drive the budget, and they deserve special attention. I’m not ready for that, and frankly I want to see what Dayton has to say before I get too excited one way or the other. This could go a lot of directions. I do know that Dayton is interested in being known as a fiscal moderate, not a liberal.
I would be interested in how you got the $1.7 billion from the information you have. I think you are missing a link.
If your math is OK, the proposal is a pretty solid one. I don’t know what the governor has in mind but if this is it I think it will be well received.
Also on the definition of income I think the state does not count all the nontaxable income such as social security, AFDC etc. That’s probably why the total amount is so low. It may also explain the very high net tax rate in the first decile.
Sorry, should have been more explicit. Table 33 on page 55 of the 2011 Tax Incidence Study shows that Decile 9 has a total income of $31B and Decile 10 has $82B. Multiply those by the net difference between their effective rate at current law and 12.3% (0.4% and 1.9%, respectively) and add them! 🙂
Thanks for the clarification on the definition of income – I think you are correct. Makes sense. Would love to see what happens to that bottom rate with a more comprehensive income definition.
Data is important. I’ll see what I can dig up too.
Milton Friedman once said,
“If the Federal Reserve System in 1929 to 1933 had been publishing statistics on the quantity of money, I don’t believe that the Great Depression could have taken the course that it did” (Friedman and Heller 1969, 80).
Yes, I agree on that. People would have freaked.
Billions
2012 Exp: 16.5 Rev:17.0
2011 15.3 16.1
2010 14.6 14.6
2009 16.9 15.3
2008 17.0 16.6
The above is from the mn budget. I look at current revenue and current exp to get a sense of structural balance. Sometime there are special things going on with the numbers, so to do a thorough job I would probably want to talk to someone at budget. someone in the legislature probably has good numbers too.
I want to go back to the 1970s, largely because I have no idea what it will tell me. I also want to do it as a percent to GSP to normalize it. That may be nearly impossible, but I’ll see what I can dig up.
Also, there was a consistent reporting framework for all states at the Census Bureau that goes back to the 90s. I used to look at it every year – it was really intense data broken down by categories like K-12, roads, etc. Comparing each state is really interesting, especially by GSP. The range was really pretty small – always around 3.5% of GSP for local, 7% for state spending. Feds are, of course, about 20%, which is to say each level of government is about twice the previous ones combined. Really interesting. Almost made a Federalist out of me. 🙂
Anyway, that may not hold today. I want to dig that up.
There is a section of the census bureau for detailed information on state and local budgets going back to 1992. The biggest question is pulling the data out of the database. They have details on every state including revenues (broad categories: Fed pass-through, taxes, fees etc) and expenditures – by state, local, and combined. Long ago I had a sheet to download their stuff and make a quick comparison between all states, it was fun.
I’ll get on that again tonight. Had to catch up on paying stuff first. 🙂 With the new Legislature it makes sense to know where we are both historically and compared to other states!
For ’14 and’15, Minnesota has a projected overage in spending of $1 billion over revenue.
The solution would be to cut spending to be in line with revenues. A portion of the projected deficit could be structural.
The budget is in balance in ’16 and ’17.
It’s not in balance because of the law that they have to include inflation for revenues, but not for expenses. I covered that last post. There is a structural imbalance of $1B per year once it is properly accounted for.
So that’s the real problem.
You are incorrect. In structural balance you look at current projected revenue vs. current projected spending. In other words you don’t include any negative or positive balance forward amounts.
Labor agreements are budget for in expenses. No extra inflation is needed.
Minn. has a spending problem for ’14 and ’15. As a conserative I would argue for adjusting policy so that spending fits revenue. Revenue increases could be considered if poor or needy people would be hurt by the policy changes and spending cuts.
Nope, I won’t yield on this one. The problem is that MMB is not allowed, by law, to do a proper forecast. They included in the footnotes what the adjustment would be with minimal reference, skirting the law the best they can. It’s a shameful situation.
See comment on previous post. MMB was as explicit as they can be, under law, that they cannot do a proper forecast. It’s sick but true.