
Last Friday the monthly Bureau of Labor Statistics (BLS) Employment Report came out, and it was lousy. Instead of an expected gain of 200k jobs it came in at 142k – a miss of 58k or 29%. The reaction in the financial press was swift and conclusive – there is no way the Fed can raise interest rates given this weakness. But there’s a bigger problem with the report than that.
It honestly can’t be believed.
It’s fashionable to say that the BLS cooks these reports to get the results they want and that no one should believe the government reports in general. That’s a general paranoid delusion that is utterly unreasonable all around. But the reports can’t be taken as pure gospel when they don’t come in exactly where they should be because there is no way they can possibly be as accurate as is demanded.

Could you please fill out this survey? Thanks!
Every month, two reports come out on the employment situation. The first one to come out is the ADP employment report, published by the private payroll company that handles about 10% of the total payroll for businesses large and small across the US. The second is the official BLS report that everyone watches much more closely.
These two reports should be the same except for hiring by government, which is not counted by ADP.
Other than that, the most important difference between them is how they are compiled. ADP has access to a very large sample of actual payroll data which they extrapolate out to a close estimate of the results for all private industry in the US. This report has only been available since 2001 because that was about the time such heavy number crunching became affordable for what is really only a sideline to ADP’s main business – writing checks for about 14M employees.
The BLS methodology was established just after WWII and is largely unchanged. It’s called the “Establishment Survey Data” because they literally call up companies and have them fill out forms telling the BLS just what happened in the last month. It’s a statistical survey of a smaller pool compiled much more manually than the ADP method.
Both methods are “seasonally adjusted” to create what should be a smooth monthly curve independent of the dramatic unemployment that comes every January.
Here is a graph of the net change in employment, month by month, since the low point in 2010. ADP is in blue, BLS is in red:
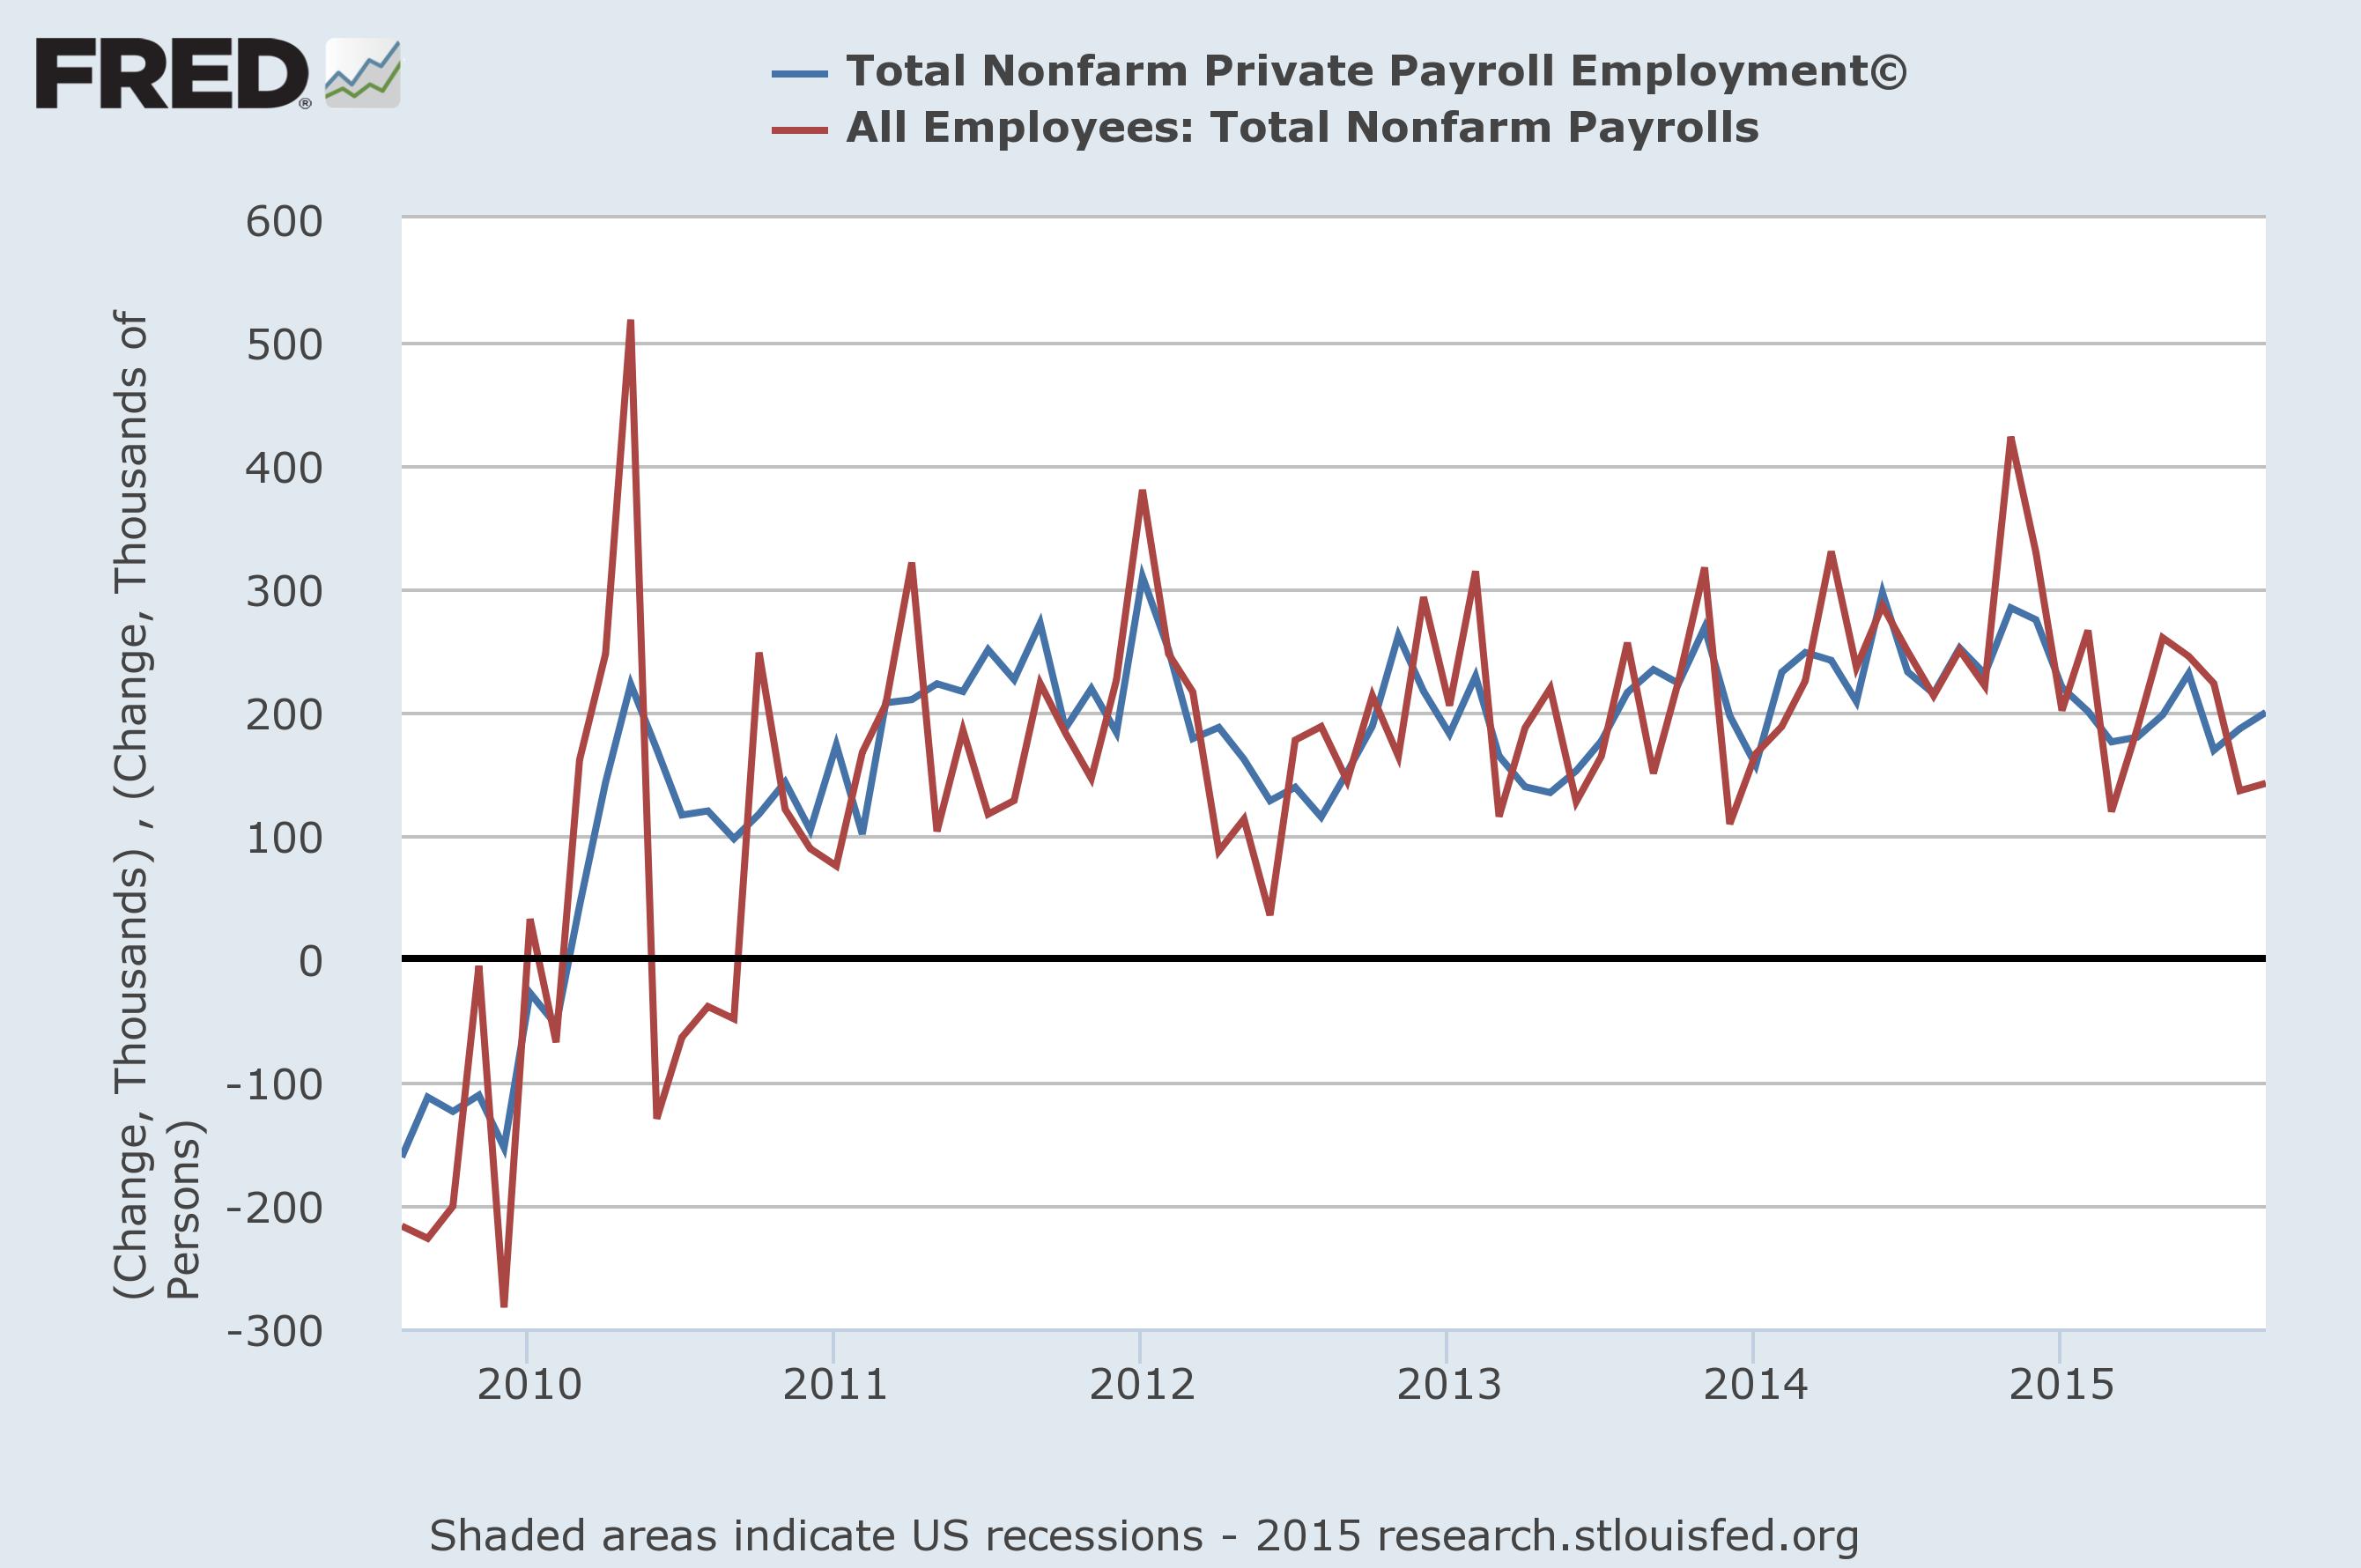
ADP (blue) and BLS (red) monthly employment reports since 2010. Data from the St Louis Federal Reserve.
Note that they seem to be describing pretty much the same data with one big exception – the red line is a lot noisier. The ups and downs from one month to the next are much more pronounced in the BLS survey. By adjusting the same graph to be a net yearly change, taking out most of the noise month by month, we can see how closely they track overall:
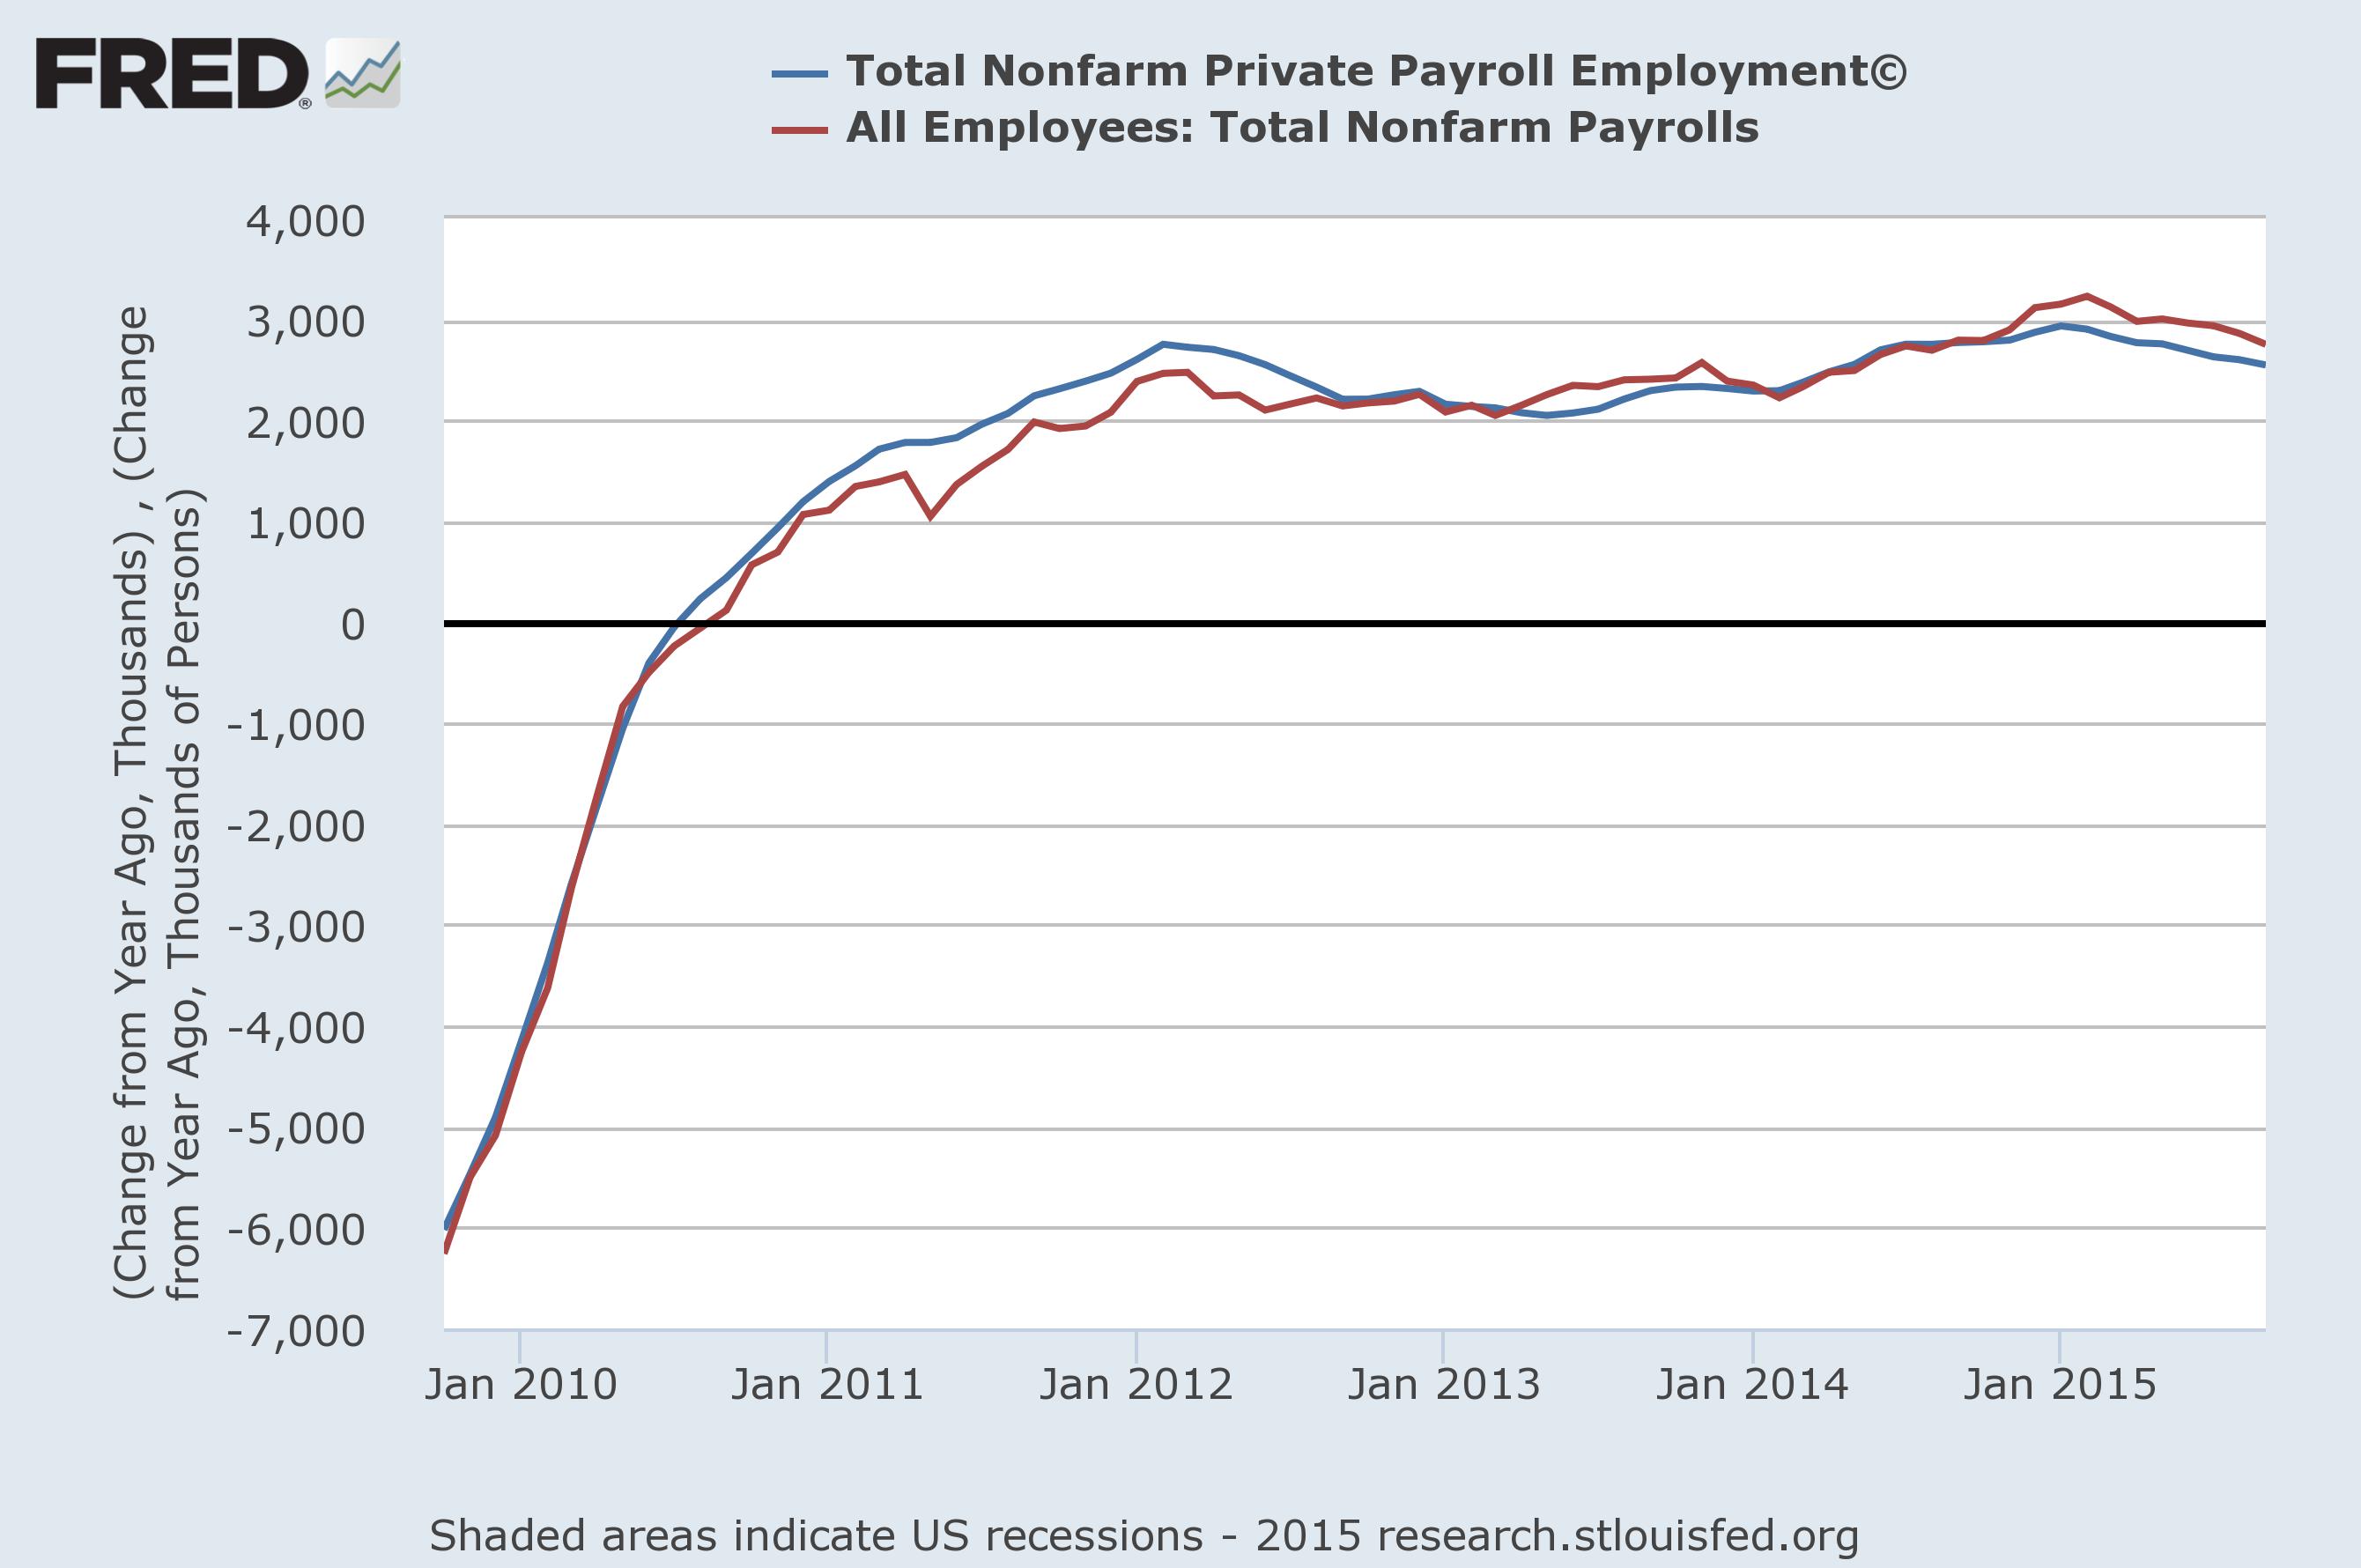
ADP (blue) and BLS (red) monthly employment reports as a net annual change each month since 2010. Data from the St Louis Federal Reserve.
The correlation between them is 92% on average, so they definitely represent the same set of data. But the BLS is much noisier.
Statistics can tell us a lot, but it also tells us the limits of what it can tell us (when we pay attention).
This has to be expected given that the BLS uses a statistical model. The net change in jobs each month is indeed on the order of 200k. That’s found by taking the total number of jobs found in one month and subtracting the previous. Given that there 142M total workers, that difference represents 0.15%. A statistical model that is that accurate is very hard to imagine, which is to say that it is amazing that the BLS gets as close as it does.
A miss of 58k is a difference of 0.04% overall. It’s almost certainly within the noise of the BLS report, although we don’t have enough information to understand the margin of error that precisely.
Should we panic over the terrible miss in the September employment report? The short answer is that we have several pieces of data to evaluate it against. The ADP report came in at the expected +200k. Previous months came in at a net similar result, on average, as well. Without any solid reason as to why things may have changed there is no reason to believe that the miss of 58k jobs is statistically valid.
That won’t stop the financial press from reporting the September employment report number as if it is far more accurate than it really is. After all, it is the official number. But it simply cannot be believed – not because someone is cooking the books but because such precision is simply not possible with the methods employed.
The ADP number? It’s probably much better. We likely gained 200k jobs in September.

Erik,
Thank you for the explanation of these job numbers. Perhaps it’s my naivete, or perhaps it’s the fact that I’m not an investor, but this is the aspect of what is generally accepted as “important economic issues” that I personally find fault with. We are constantly bombarded with “projections” that fall above or below “expectations”. It all seems like the base language of “gambling” morphed into an argot to give it the patina of seriousness. As you point out, the BLS figures are not to be taken as gospel……and yet it seems they are, with all sorts of financial institutions reacting to each bit of “titillating” news.
We see this too in the market, where if a corporation doesn’t meet its quarterly goals, their stock is affected and heads will potentially roll. It seems to me, as an outsider to all of this economic bustle, that economically we treat these various indicators as ancient Kings treated the Oracle at Delphi. This is a hell of a way to run governments, economies and corporations.
With this economic environment, I’m of two minds and can’t decide which is more valid. Either the whole global economic environment is wildly out of control, responding to half truths as if they were gospel, or there are wiser heads behind the scenes, who merely use these measurements as manipulation for the rubes in the game.
In any event it’s always a pleasure reading you because you provide insight that is not available elsewhere.
We want to run our world with numbers because everything is supposed to be rational and in control. But there are limits to our ability to do that. Worse, the numbers are usually only fuel for our prejudices and need to fight about nearly everything.
Can we really run an economy entirely with numbers? The short answer is no, because hope and fear play a big role in where things are going. People are not all that hopeful right now so they tend to be careful with purchases, keeping it cool. And there are definite limits to what we can measure in the first place.
Good blog. More evidence that no one really knows what is going on.
I think that’s a little strong, but we don’t know as much as we would like. My conclusion here is that we DO know we gained about 200k jobs in September no matter what the numbers say.
Seems to me that the press is the problem not the BLS. If they reported these numbers with the accuracy they really have there wouldn’t be a problem.
YES! That is the real problem. It’s a lot like election polling – a difference inside the margin of error is not a difference.
I never believe the jobs reports. They lie about the unemployment rates, as well as the rate of inflation. Why would anyone believe what their government says? The truth of the matter is there are more people going to foods banks than ever before and we have a substantial homeless population.
Leslie
The unemployment rate is NOT a lie, it is what it is. The “headline” unemployment rate, U3, only tells part of the story and no one in the profession believes it is the best measure. U6 is also reported at the same time and is publicly available, but largely ignored by the media. That stands at 10.0%. http://www.bls.gov/news.release/empsit.t15.htm
It’s skewed to what “the powers that be” want to make it.
Leslie
People allege this all the time, but there is no evidence to prove that. Because of the complex way it is calculated it is indeed a “black box” to most people, which fuels skepticism. But you cannot argue that those in charge have consistently gotten good employment numbers right before an election, for example.
There’s no lies about the increased numbers of people who are dependant upon food banks. Homeless shelters are bursting at the seems. Kids are moving back home. I personally, know of a number of
unemployed/underemployed people.
Leslie
I think the 10% U6 unemployment tells that story – and it was as high as 17%. 1 in 10 people does not have enough work – that is a very serious crisis, and it’s still about as high as it ever was before 2010.
It’s a serious problem alright.
Leslie
If it is this variable, what does that say about the unemployment rate (or I guess in your case unemployment rates plural)?
We have to look at the net accuracy. All unemployment rates (thank you for the plural!) are reported to the tenth of a percent, or part per thousand. Do we have that level of accuracy? It’s hard to be sure, but we are at least close – it does go up and down 0.1% from one month to the next but that may be real.
What I’m arguing here is that there is no way they have accuracy beyond that, however, which I think we can say for sure.
Pingback: Ready for Liftoff? | Barataria - The work of Erik Hare