
Stocks appear to have stabilized after a rough week. But several questions remain. Was this a one-time shock event, or is it a correction? And if it’s a correction, how low can things go?
We can be sure that what has happened so far is not an isolated event, but part of a major change in the regime from loose, cheap money to a more normal economy. Corporate profits are high, and America is taking care of business, so there’s no apparent reason to be terribly afraid.
Yet the change is significant, and precisely how significant will not be clear for some time. Here is what to watch for as stocks and other markets absorb the change and make a transition into a new economy.
Reading between the lines is not all that hard.
Before anyone can make predictions, it’s critical to start with exactly what is happening to the market. There is no immediate fear of a recession or other downturn which would hurt corporate profits. Everything appears rosy in terms of the fundamentals.
As we covered last time, the three important changes are:
- Inflation is making it difficult for the Federal Reserve to maintain historically low interest rates.
- Foreign money, particularly from China and Europe, is going back home as their situations stabilize.
- US Government borrowing stands to increase.
In all of these cases, the key effect is on US treasuries or debt. The key to watch is the benchmark 10yr treasury, whose interest rate is set by market forces in response to these other factors. Where it stood at a yield of 1.4% interest just 18 months ago, it has blossomed up to 2.8% today.
What does this mean for the stock market?
Money talks, but bonds have a nationally syndicated show.
A good place to start is the null hypothesis, or that this is a very small bump in an otherwise smooth road. That case was made very well by this excellent article from Bloomberg, arguing that we are nowhere near the point where treasury yields are more attractive than stocks. It’s a good piece, direct and to the point. More importantly, it sets a marker for converting current stock valuations into 10yr treasuries – somewhere around 4.2% yield we should be concerned.
Let’s take this as a given.
We can match this to an equivalent Fed Funds Rate (FFR) in order to keep an eye on action by the Fed. This chart is the spread between the 10yr and the FFR since 2000:
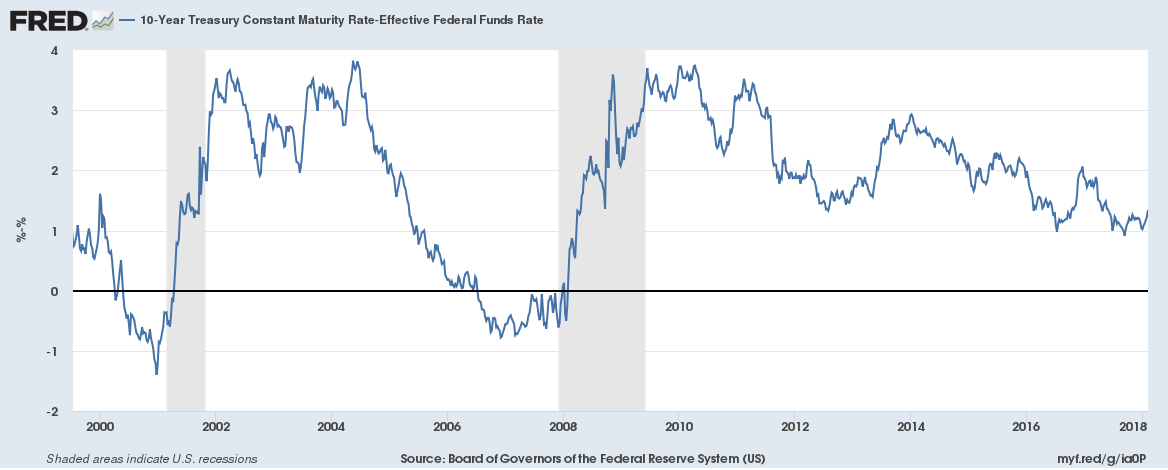
The net spread between the yield on 10yr Treasuries and the Federal Reserve Funds Rate since 2000.
Note that while it is all over the place, there are specific regimes. It averages 1.7% or 1700 basis points (BP, or 1/100 of a percent) over this period. It’s currently at 1300 basis points. Just before a recession, when the treasury yield curve was inverted, it went negative. During times of heavy borrowing, such as 2008-2012, it ran 2800 basis points.
So let’s take 1300 BP as best case, 1700 as average, 2800 as worst case.
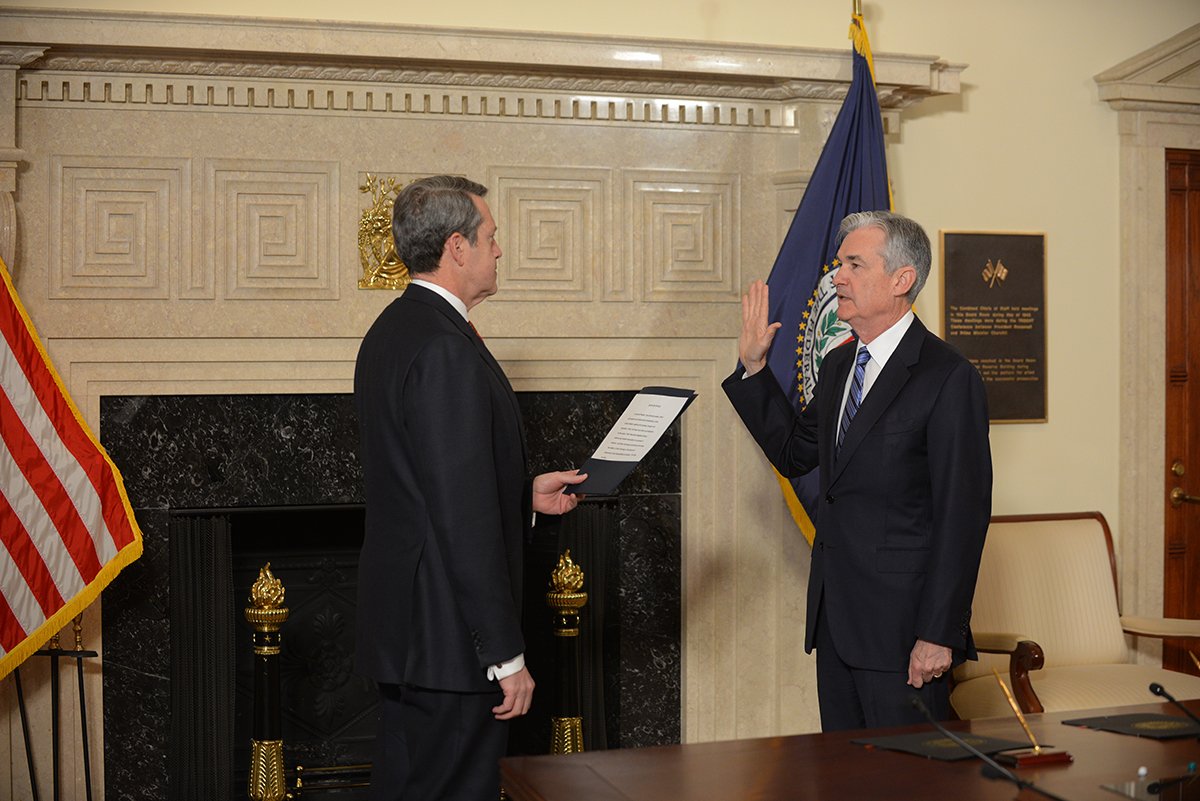
Jerome Powell is sworn in as Federal Reserve Chair.
The FFR is currently at 1.5%. Most Fed watchers see 3-4 quarter point rises in store for this year, bringing it up to 2.5%. That implies a 10yr bond yield of 3.8% by the end of the year – less than the target 4.2%. So everything is good?
That’s the point. The current market valuation is entirely best-case scenario. There is no upside plugged into It, and it doesn’t take into account downside.
At a more normal spread, a 2.5% FFR should give us the magic 4.2%, meaning that stocks should neither go up nor down. But at a spread more consistent with heavy borrowing, we have a potention 10yr of 5.3% yield.
That implies that stocks are over-valued by about 18%. That is the worst-case scenario target drop.
In reality, it’s far from the worst case. The Federal Reserve has a target inflation rate of 2%. Everyone agrees that we will top that this year, generally running around 2.5% inflation. They also believe that there will not be significant Fed action to tighten rates to prevent inflation from getting out of control, particularly with a falling stock market. In short, no one is banking on the Fed “Taking away the punchbowl just as the party is getting started,” their traditional role.
So this is what to look for:
Cheap money is gone. Exactly how gone is what we’re debating.
Inflation Hawkery: If the members of the Federal Reserve Open Market Committee, particularly new Fed Chair Jerome Powell, decide that growing inflation is a problem it’s all over. Given that the new chair is a centrist with anti-inflation leanings, you’d think everyone would be more nervous about this. Watch what Powell says and the results of the next Consumer Price Index for January on February 14th.
10yr Bonds: Currently hovering around 2.8% yield, a break above 3.0% would signal a strong panic. Today, 7 Feb at noon, there is an auction for $24B in 10yr bonds. If that goes badly, there will be trouble. This is something that can be watched on a daily or hourly basis by those who are obsessive.
Government Shenanigans: Alas, there is always Washingtoon to screw everything up. There are some signs that the appetite for more debt, fueled by the tax cut, has not made it to the bond market – and won’t until the debt ceiling is raised. Watching Treasury auctions for sudden moves will be a sign that more debt is flooding onto the market and the yield is about to go up. This is all assuming that no one threatens default during the shutdown, which would be catastrophic, or any other stupid things.
In summary, everything is priced for perfection right now. Nothing bad can happen. We do know that bad things are looming on the horizon, so it’s all about watching them come in.
If stocks fall, how far will they go?

It’s not actually a science.
Generally, for that question, you ask a chartist. Those are people who follow the trends in the market and look for points of relative stability on the way up that can serve as cushions on the way up. There aren’t any, as stocks have been on an upward tear with little pause for eight years. Easy come, easy go.
We can see that the S&P500 open today was off about 6.2% from the peak. In March of 2017 there was a bit of a pause around 2340, or 18.6% off the peak. That’s a good support level if things do start falling hard in response to Federal Reserve action. Below that? November 2016 saw the S&P500 at 2120, a breathtaking 26% drop from the peak. That’s probably worst-case scenario, but what’s important is that there is little support before that.
So unless the chartists come up with something better, and I’m waiting to see it, the drop is as quick as the fall. Note that charting is one of those things which only works to the extent that there is belief in it, but a lot of money does believe. So it works. Mostly.
Most importantly, it’s critical to remember that this is all about interest rates. We know what to watch and whether there is some justification for the best-case scenario which the market is priced at now.

Watch out for an inverted yield curve. That would be bad news
You are right, I have neglected all signs of a recession. My general assumption is that the underlying economy is strong. But there is a chance that short-term rates might bid up first and the curve inverts. That would be very bad.
Thank you, this is a good article.
My pleasure! Please, any questions you might have I’ll do my best to answer or at least find a good article that addresses them.
My other economic indicator is how long the line is at Starbucks (ie consumer confidence) and it hasn’t shorten any this week so I am inclined to think that this week was a blip triggered by automatic trading triggers. Excess me, Grande Latte thanks…
Dear Eric Hare,
Thanks for explaining things so well and easy for the reader to follow. I too believe that the underlying economy is strong.
II think that the stock market correction which has taken place, was way overdue . I have been reading that the US stock market is now about 25 percent higher than it would have been had it grown at its historic average pace.
However, If the stock market suddenly reverted to its long-term trend, implying a fall of almost 25 percent, that could cause the US economy some hiccups.
Hugs, Gronda
Pingback: A Bold Prediction | Barataria - The work of Erik Hare
Pingback: Inflation is Back | Barataria - The work of Erik Hare
Pingback: Other People’s Money | Barataria - The work of Erik Hare
Pingback: It’s a Bear Market | Barataria - The work of Erik Hare