
Where are the jobs? Job creation has been the hot economic topic since the big downturn in 2008. The sooner we have full employment the sooner demand for goods and services will turn around and there will be a net upward pressure on wages. But in 2015 the rate of increase in jobs has slowed somewhat, barely hitting 200k net every month from a solid run of 220k the year before. What happened?
The data is even more confounding when you look at the net good news on jobs – that initial claims for unemployment per week are at an all-time low as a percent of total jobs. We’re not creating jobs as fast as we should, but we also aren’t losing them. Along with a large backlog of unfilled job postings there is substantial evidence that something is wrong. Is it a skills gap? Or something else?

A thing of the past?
The most worrisome part of the equation has to be the net job growth, which has definitely slowed down. In May a reasonable but hardly robust net 201k jobs were created, but that has to be weighed against the slow 169k in April and 189k in March. We are definitely running behind last year’s pace of 220k per month. Most of the hiring remains with small businesses, less than 50 employees, which still accounts for more than 60% of the net jobs created.
Big business is simply not hiring. But it’s not firing, either.
The total initial claims for unemployment (four week moving average) is down to 272k per week from 314k per week last year. This is the most real-time data on jobs that we have because it is compiled every week from filings at all state offices. Back in 2009 it was a reliable indicator of the state of the economy because we were losing 642k per week – a feature that dominated any jobs discussion.
Not any more. In fact, if you adjust the initial claims by dividing it by the total number of jobs you get the graph below, which shows initial claims as a kind of “turnover” figure in jobs as a percent lost each week:
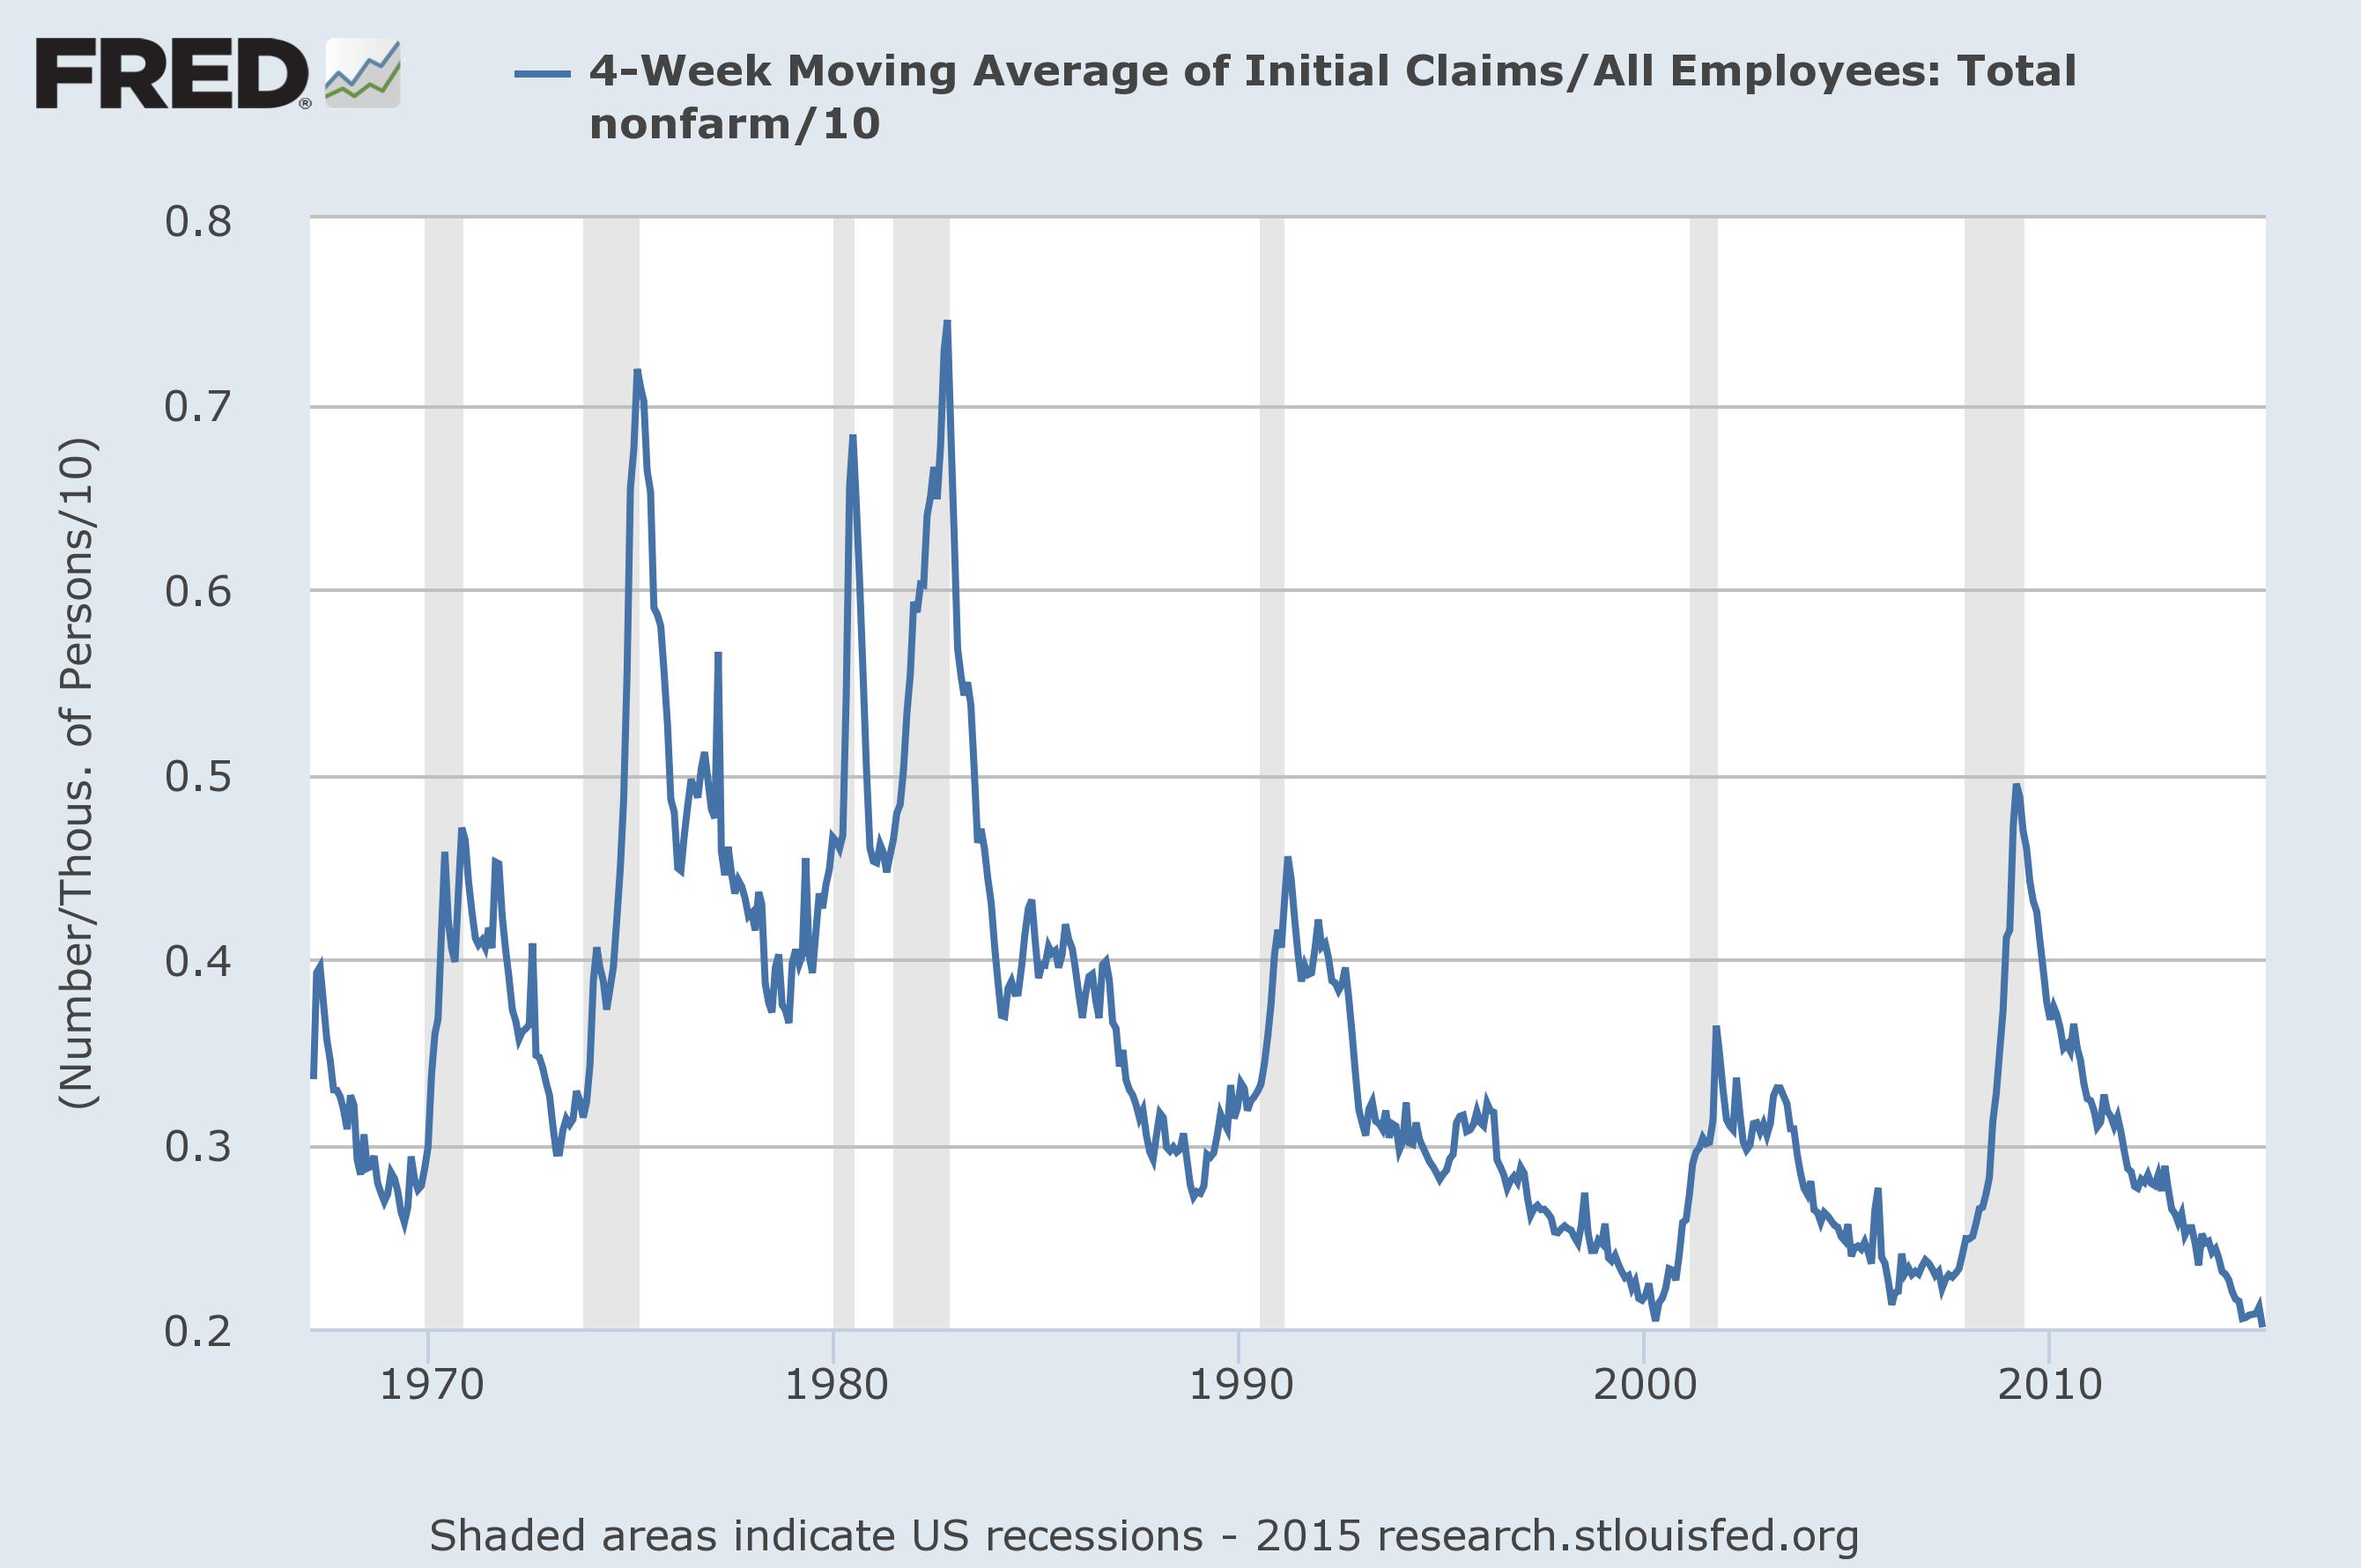
Initial Claims for Unemployment over Total Employment, displayed as the net percent of all jobs being lost each week. Chart from the St Louis Federal Reserve.
Note that at the peak nearly 0.5% of all jobs were lost each week, which annualizes out to about 25% of all jobs. Some workers are used to seasonal work, so you can’t simply add up the total claims to get the workers out on the street. But at today’s 0.2% only 10% of all jobs (not workers!) turnover in a year.
Note that back in the 1970s and early 1980s the figures were consistently higher. There was a lot more turnover back then, running about twice as high as a baseline. It’s an interesting artifact that is worth remembering.
Low job turnover is a feature of today’s economy, and it’s worth looking at some more charts to find out why. The Job Openings and Labor Turnover Survey (JOLTS) is a monthly publication by the Bureau of Labor Statistics (BLS), and it runs about 2 months behind. It doesn’t have the long history of other measures, but it sure is packed full of great data. This chart of applicants per job opening tells a part of the story:
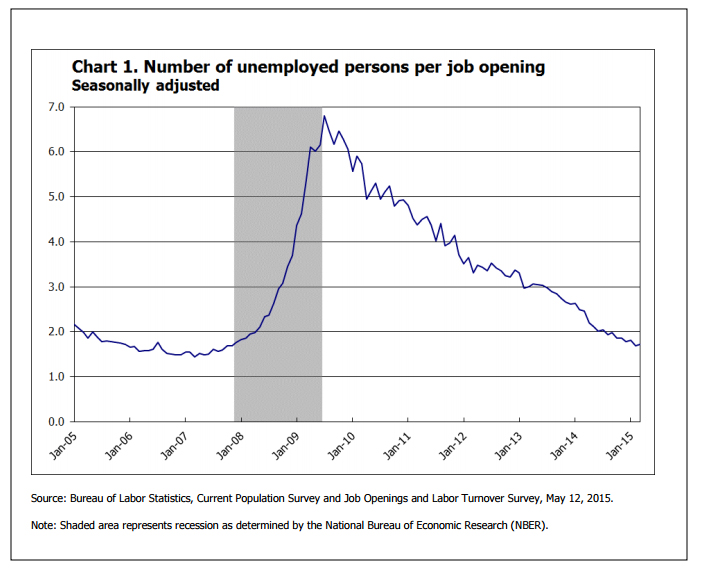
Unemployed Persons (as per U3 definition) per Job Opening. From the March 2015 JOLTS report (BLS).
At less than two unemployed persons per job opening, we’re running at a pace close to the all-time low in 2006 – when the unemployment rate was 4.5%. This is an important figure for another reason, which is highlighted in another chart.
The “Beveridge Curve” maps out openings versus the unemployment rate, and is named for Lord Beveridge, a noted economist who was the architect of the Labour-run postwar UK.
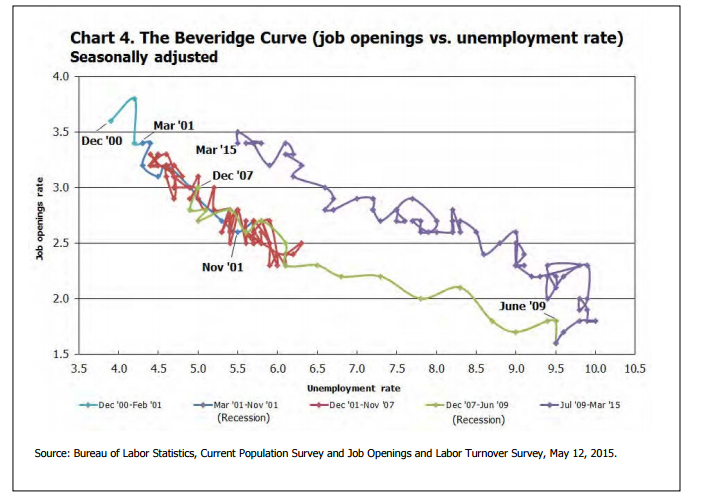
The Beveridge Curve since 2001. From the March 2015 JOLTS report, BLS.
On this chart, series in time wander along the curve showing the relationship between net openings and the unemployment rate. Different eras are in different colors through this depression era, and most of them fall along one curve. Not so since 2009, however. The net unemployment rate has been stubbornly higher than the jobs available would suggest. At over 5M openings today, we should indeed have an unemployment rate of about 4.5%.

Workers of the World, Unite!
The difference between that and the 5.4% we have in reality is about 1.4M people out of work.
This may simply be evidence of a “skills gap”, where employers cannot find workers that have the experience they need. It also might be a sign that employers are being very picky about who they hire, insisting on a high level of skill where in the past they might expect an employee to grow with their career.
Whatever the case, there is definitely a new economy facing today’s unemployed. Employers would like to hire them, but are apparently not finding what they need to ink the contract. Employers are also holding on to the skilled employees they have, as shown by the historically low initial claims. Once they have someone with the skills to pay the bills they never let go.
Is this the new economy that we can expect going forward? Barataria will go out on a limb and say that no, this isn’t the economy of 2020, and that things are still on track to change around 2017 or so.

Who will replace him when he’s ready to rest?
If this is a sign that employees are simply not “work ready” with the skills necessary to get a job, something will change. Either technical colleges or fergoshsakes Capella online university will find a way to fill the gap and deliver the workers that employers need or employers will start working hard to create programs for new employees, either on the job or working with schools.
If this is a sign that employers are still very gunshy and insist on top performers right away, it may still take time to change. But is will as the pool of employable people starts to dry up as the peak Baby Boom hits 65 years old starting in 2017. Employees may want someone as reliable as old Bob has been for 45 years, but at some point they will have to shift.
Beyond those considerations, the simple fact that jobs are actually more stable than they were 40 years ago is a sign that a larger change has occurred. Increased reliance on automation has definitely increased productivity while shedding jobs, but it makes those workers who have a steady gig much harder to replace.
That is one trend that has certainly taken place, skills gap or not. How the education systems and large employers respond to the reality of generational turnover in an economy that values higher skills all the time is the as yet unwritten story of how this depression will finally end.

I like the post. I do know that many skilled American jobs are taken by indentured servants on H1B visas. We have a great country but, its gone down the tubes in the USA. I wish we could phase out the H1B visas and increase the availability of different kinds of education as well as multimode transit and get rid of all these automobiles.
Importing skills is one solution to whatever the problem really is, but I can’t see this as a long-term solution. As you say, they are essentially indentured servants – tied completely to their job. That’s not good for anyone.
Thank you for sharing
You are most welcome!
If there is a skills gap, what areas is it in?
It’s always a vague “technology” gap, which astounds me. There are plenty of young people with good tech skills, but they don’t have experience. I honestly think that companies have to start hiring young people and cultivating them to grow with their company and stop insisting on a high level of expertise in new areas.
One article I did not use might be illuminating here. While there is a lot of debate as to whether there is a “skills gap” at all, this article focuses on the role of a changing economy and the need for business to step up and do its part. https://hbr.org/2014/08/employers-arent-just-whining-the-skills-gap-is-real
Good blog.
Thanks!
While I’m sure you are much more knowledgeable on the overall subject, I would venture a guess that part of low turnover, at least here in US is an aging work force, who’s wages and benefits have been cut/frozen, who fear being able to find another job if they leave the one they’ve got and cannot retire when they thought they wanted to, to open up a position for an upcoming worker – – – well – I don’t have the factual stats to back up my opinion, but these are things I’ve noticed/gleaned over the past 10 years of uninformed observations – 🙂
A good guess, but what if I told you this is measured? 🙂 This is called the “quits rate”, and it’s one of the things that Fed Chair Yellen says she is watching as a sign the economy is picking up. It did indeed hit a terrible low in 2009, and is back about halfway to where it was in 2000.
So, yes, you are right! But it is slowly getting better.
Thanks for making it easy to find/read more on the subject 🙂 One lifetime will never be enough to fully research everything I want to understand better. 🙂
Employers are not ready to invest in young workers with no experience that will only flee when they get a better offer. The only solution is to invest in employees and pay the wages needed to keep them.
I think you are completely correct. Let’s set up a timeline for the turnaround:
Step 1: Jobs available (check!)
Step 2: Employers are willing to cultivate young people to develope skills (not there yet!)
Step 3: Employers have to pay to keep those employees there (later!)
Give it until 2017, I say. We’re getting there.
Pingback: Bad Weather Ahead? | Barataria - The work of Erik Hare
Pingback: Demographics is Still Destiny | Barataria - The work of Erik Hare
Pingback: Drama Over Yet? | Barataria - The work of Erik Hare
Pingback: Ready for Liftoff? | Barataria - The work of Erik Hare
Pingback: Job Growth Crashes? | Barataria - The work of Erik Hare