
Just about 12 hours after this post goes up, the world will see the ADP Employment Report for July. We can expect it to show a net gain of about 240k jobs, about the same as the 237k gained in June. It’s a decent number, higher than the 220k or so averaged last year at this time, but what does it really mean?
Context is the key to understanding the data that drives our world, so let’s get going with some solid background on what these figures mean. It’s time for a few charts and graphs once again to demonstrate just how strong things really are going into the magic period where Baby Boomers start to retire in droves – sometime after 2017.

Charts are fun.
We’ve been relying heavily on charts lately to tell the story in Barataria for one simple reason – charts are fun! Trends can be annotated in text and a story woven together, but there’s nothing like a line on a graph to tell you where we’ve been and where we are going. Sometimes, the right graph makes it about as plain as day.
The ADP Employment Report is a wonderful tool that is much maligned in the economic press for reasons we can’t explain. As the payroll processor for about 10% of all workers they see things right away that the official surveys simply cannot. They have access to the data that drives our economic reporting in real time.
The one flaw? They only include private hiring, not government. But the difference is very small.
Today’s rate of job gain is running about 10% higher than a year ago, which is decent. We haven’t seen a solid wave of hiring that really busts out the data, but we don’t reasonably expect to. Change happens slowly, excepting the big meltdown from 2008-2010. But it takes more than a monthly number to really make sense of things.
Here is the graph of the percent change in employment since 2002, the year the ADP Employment Report started, in red. The blue line is the net change in the number of people 16-64 years old, generally the working age population, in the same period:
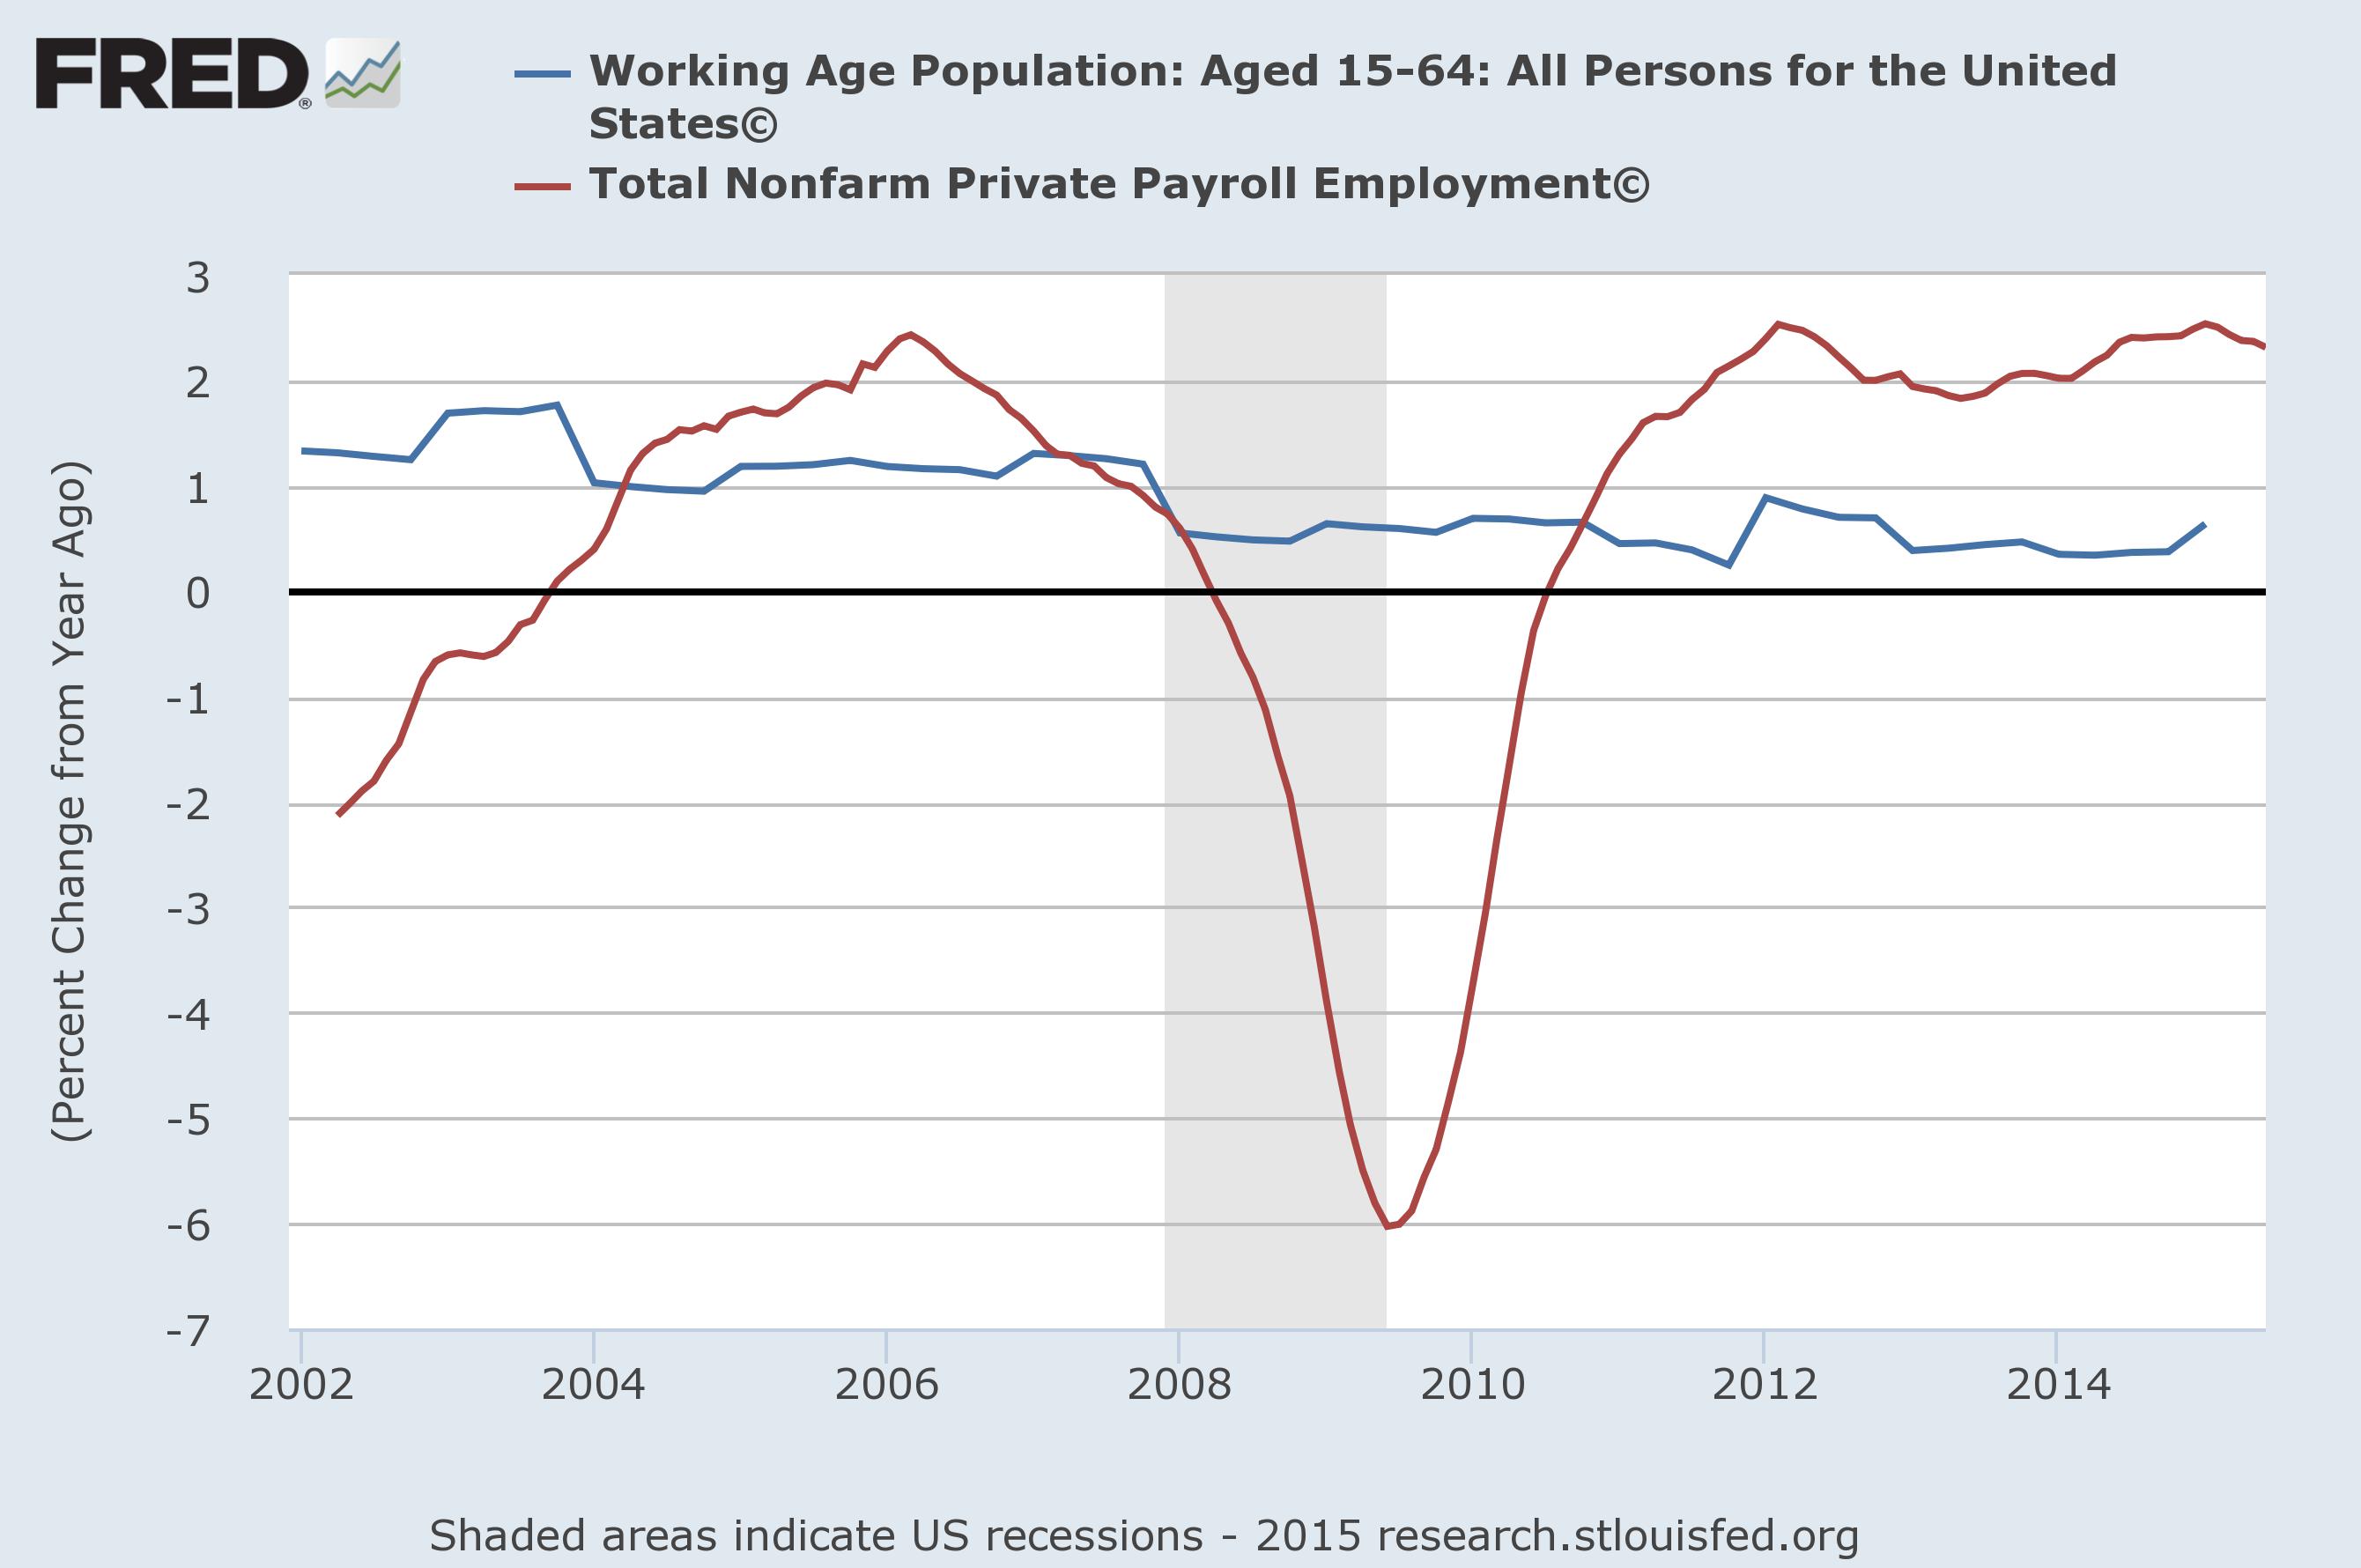
Working age population growth in blue, employment growth in red. Data from the St Louis Federal Reserve.
We’ve been gaining jobs at a rate of about 2.4% where the working population is growing at a rate of 0.5%. The net difference is 1.9%, which is about what you can expect the unemployment rate to fall in the same period.
But there’s a problem, however. The broadest measure of unemployment, U6, is not falling at anywhere near that rate. It’s dropping about 1.1% per year, averaged over the last year.
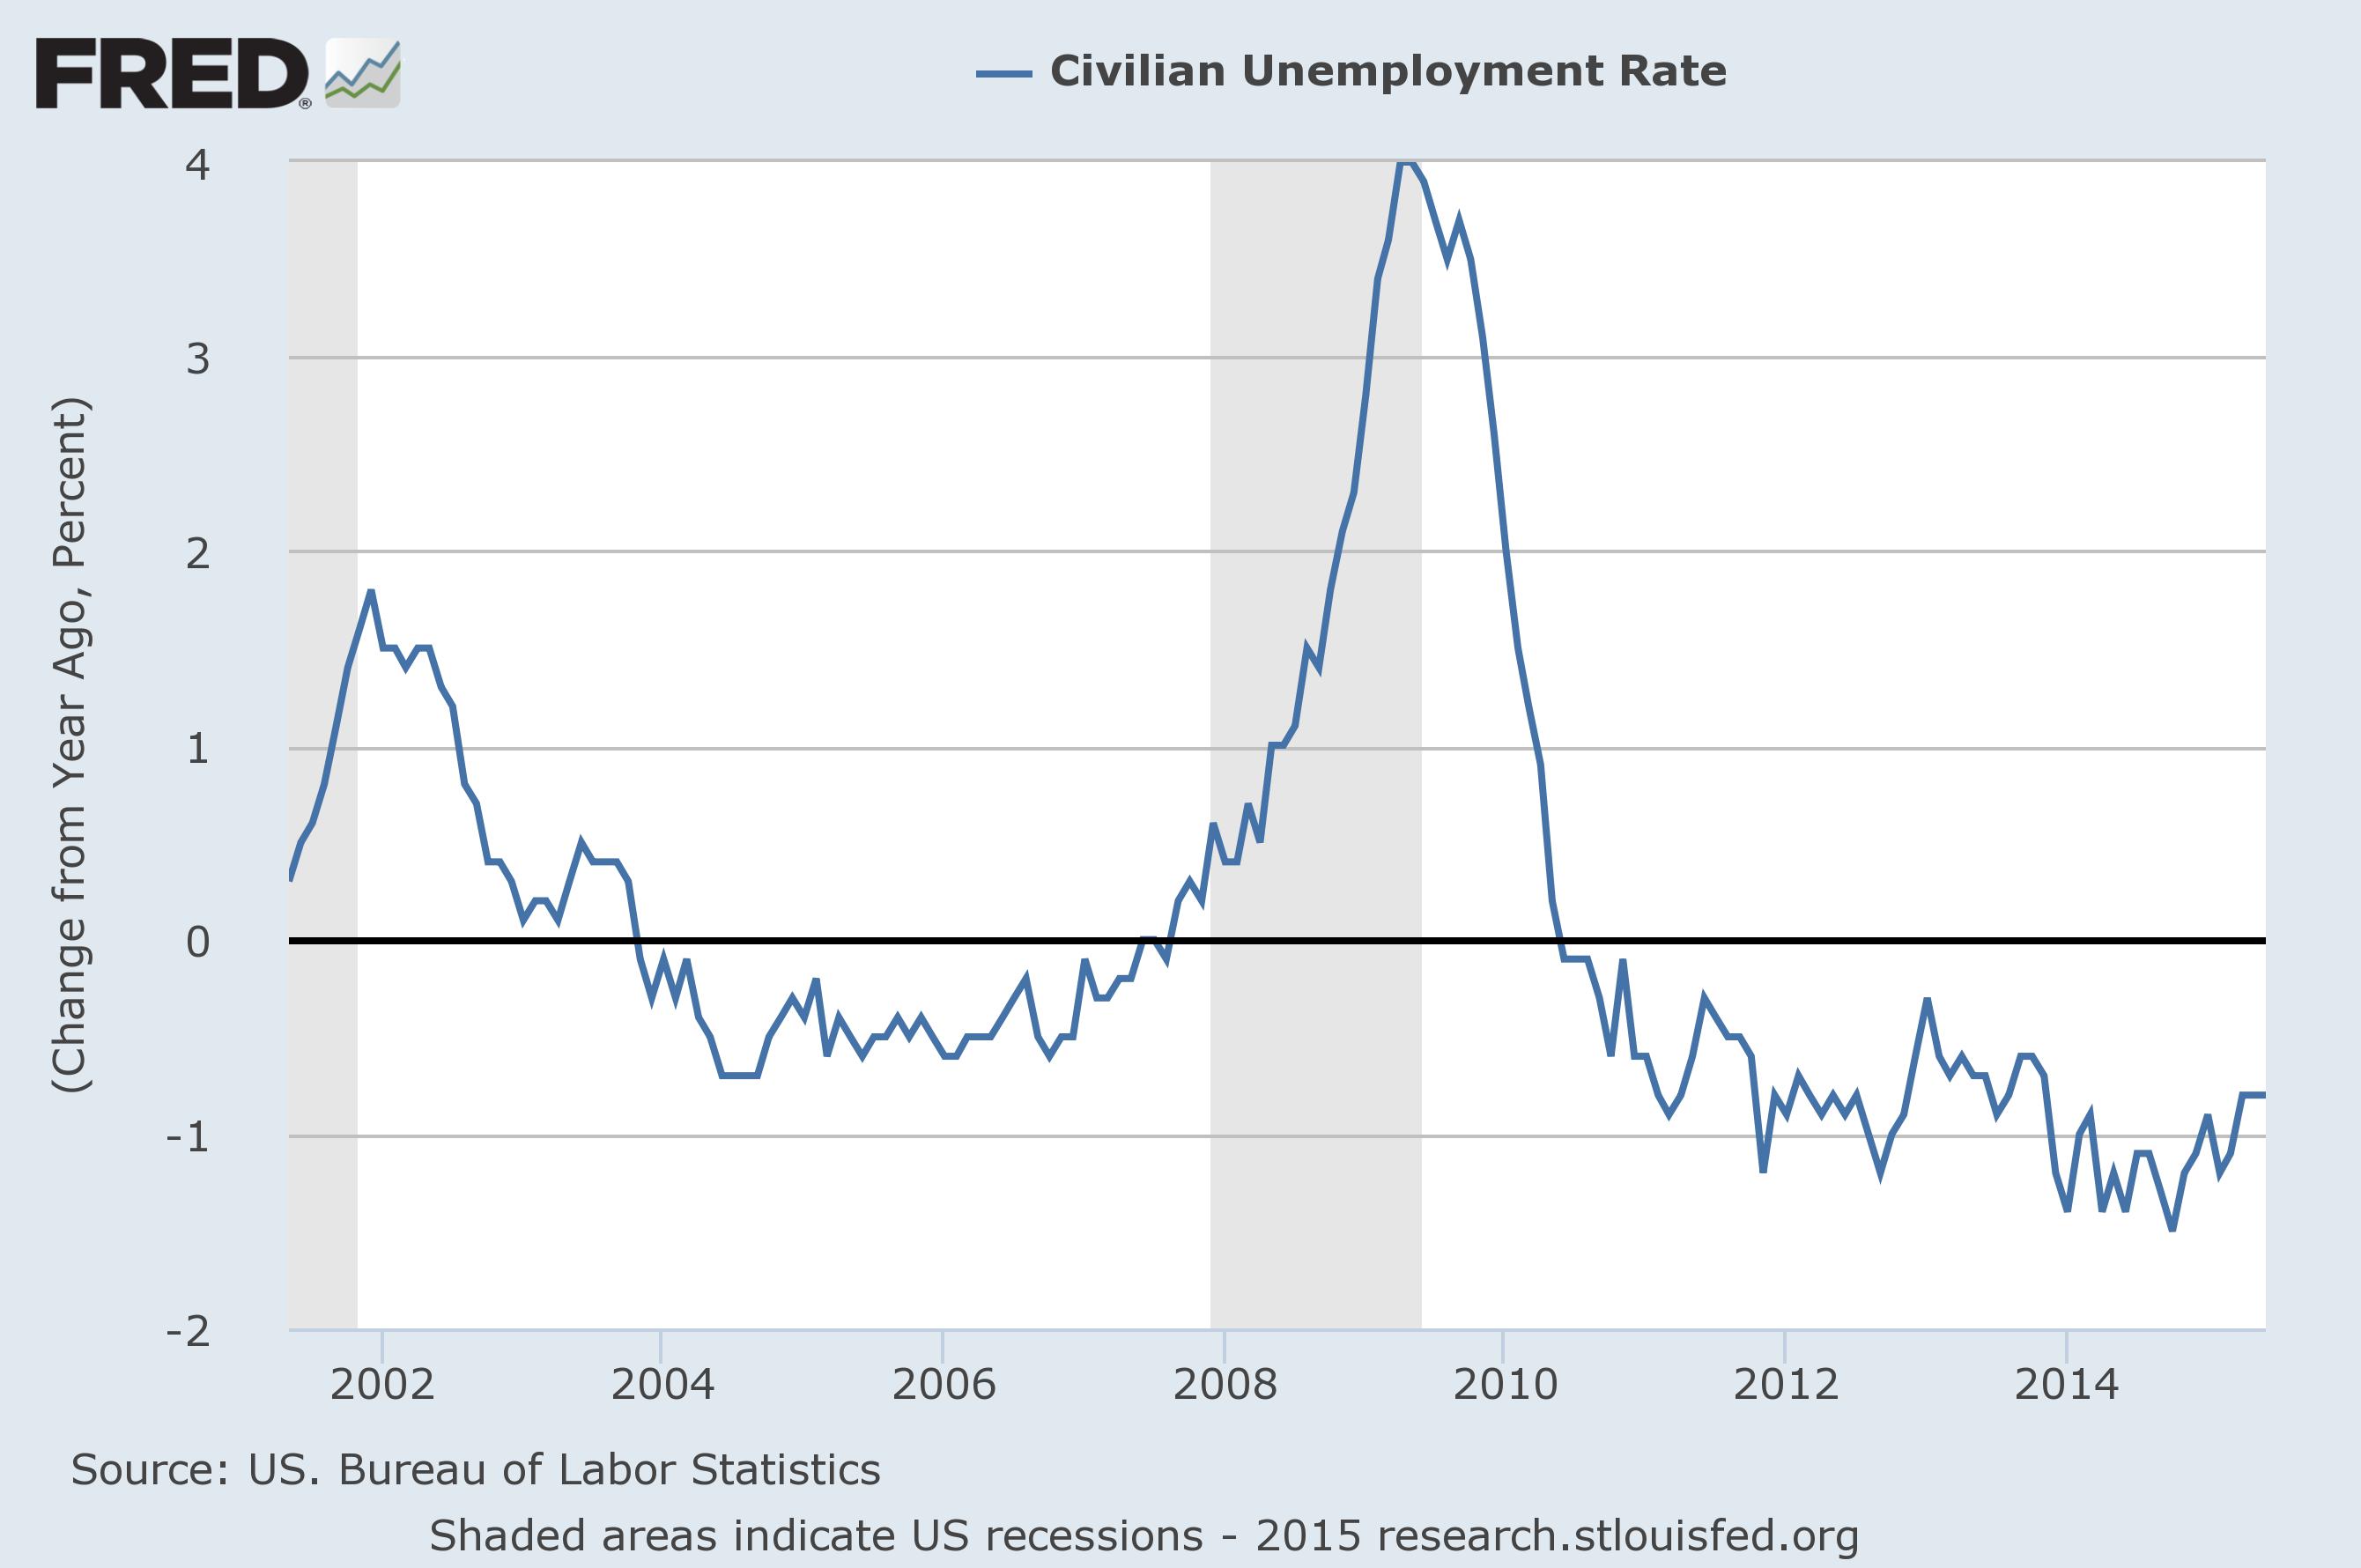
U6 Unemployment, the broadest measure, shown as a net change year to year.
What could be the difference? We’ve talked in the past about those workers who are now over 65 years old, which is to say those not normally counted as “working age”. Surveys have shown that, on average, they expect to retire around 65 like anyone else – a few earlier, a few later. But what if that doesn’t happen?

The children of Endless Summer aren’t doing so well in an Economic Winter
The short answer is that they will start retiring eventually, which brings us back to 2017 as the Year Everything Changes. The peak Baby Boom was from 1952-1956, and those workers will start hitting 65 years old in 2017. They may not all retire, but a lot will. And those who wait until 68 will still be out of the labor force by 2020 in large numbers.
We are just starting to see the retirement wave come through. When it hits there will be a lot more work to go around.
This is important because, as we’ve shown before, there is apparently only so much paid work to go around. That’s not to say there isn’t always more work to do – raising the kids, painting the houses, trimming the hedges – but if no one is willing to pay for it then it really doesn’t count, at least economically. It takes us back to the “Workforce Participation Rate”, the total number of people with at least some job divided by the total population. This chart is shown from 1947 to give it a little context:
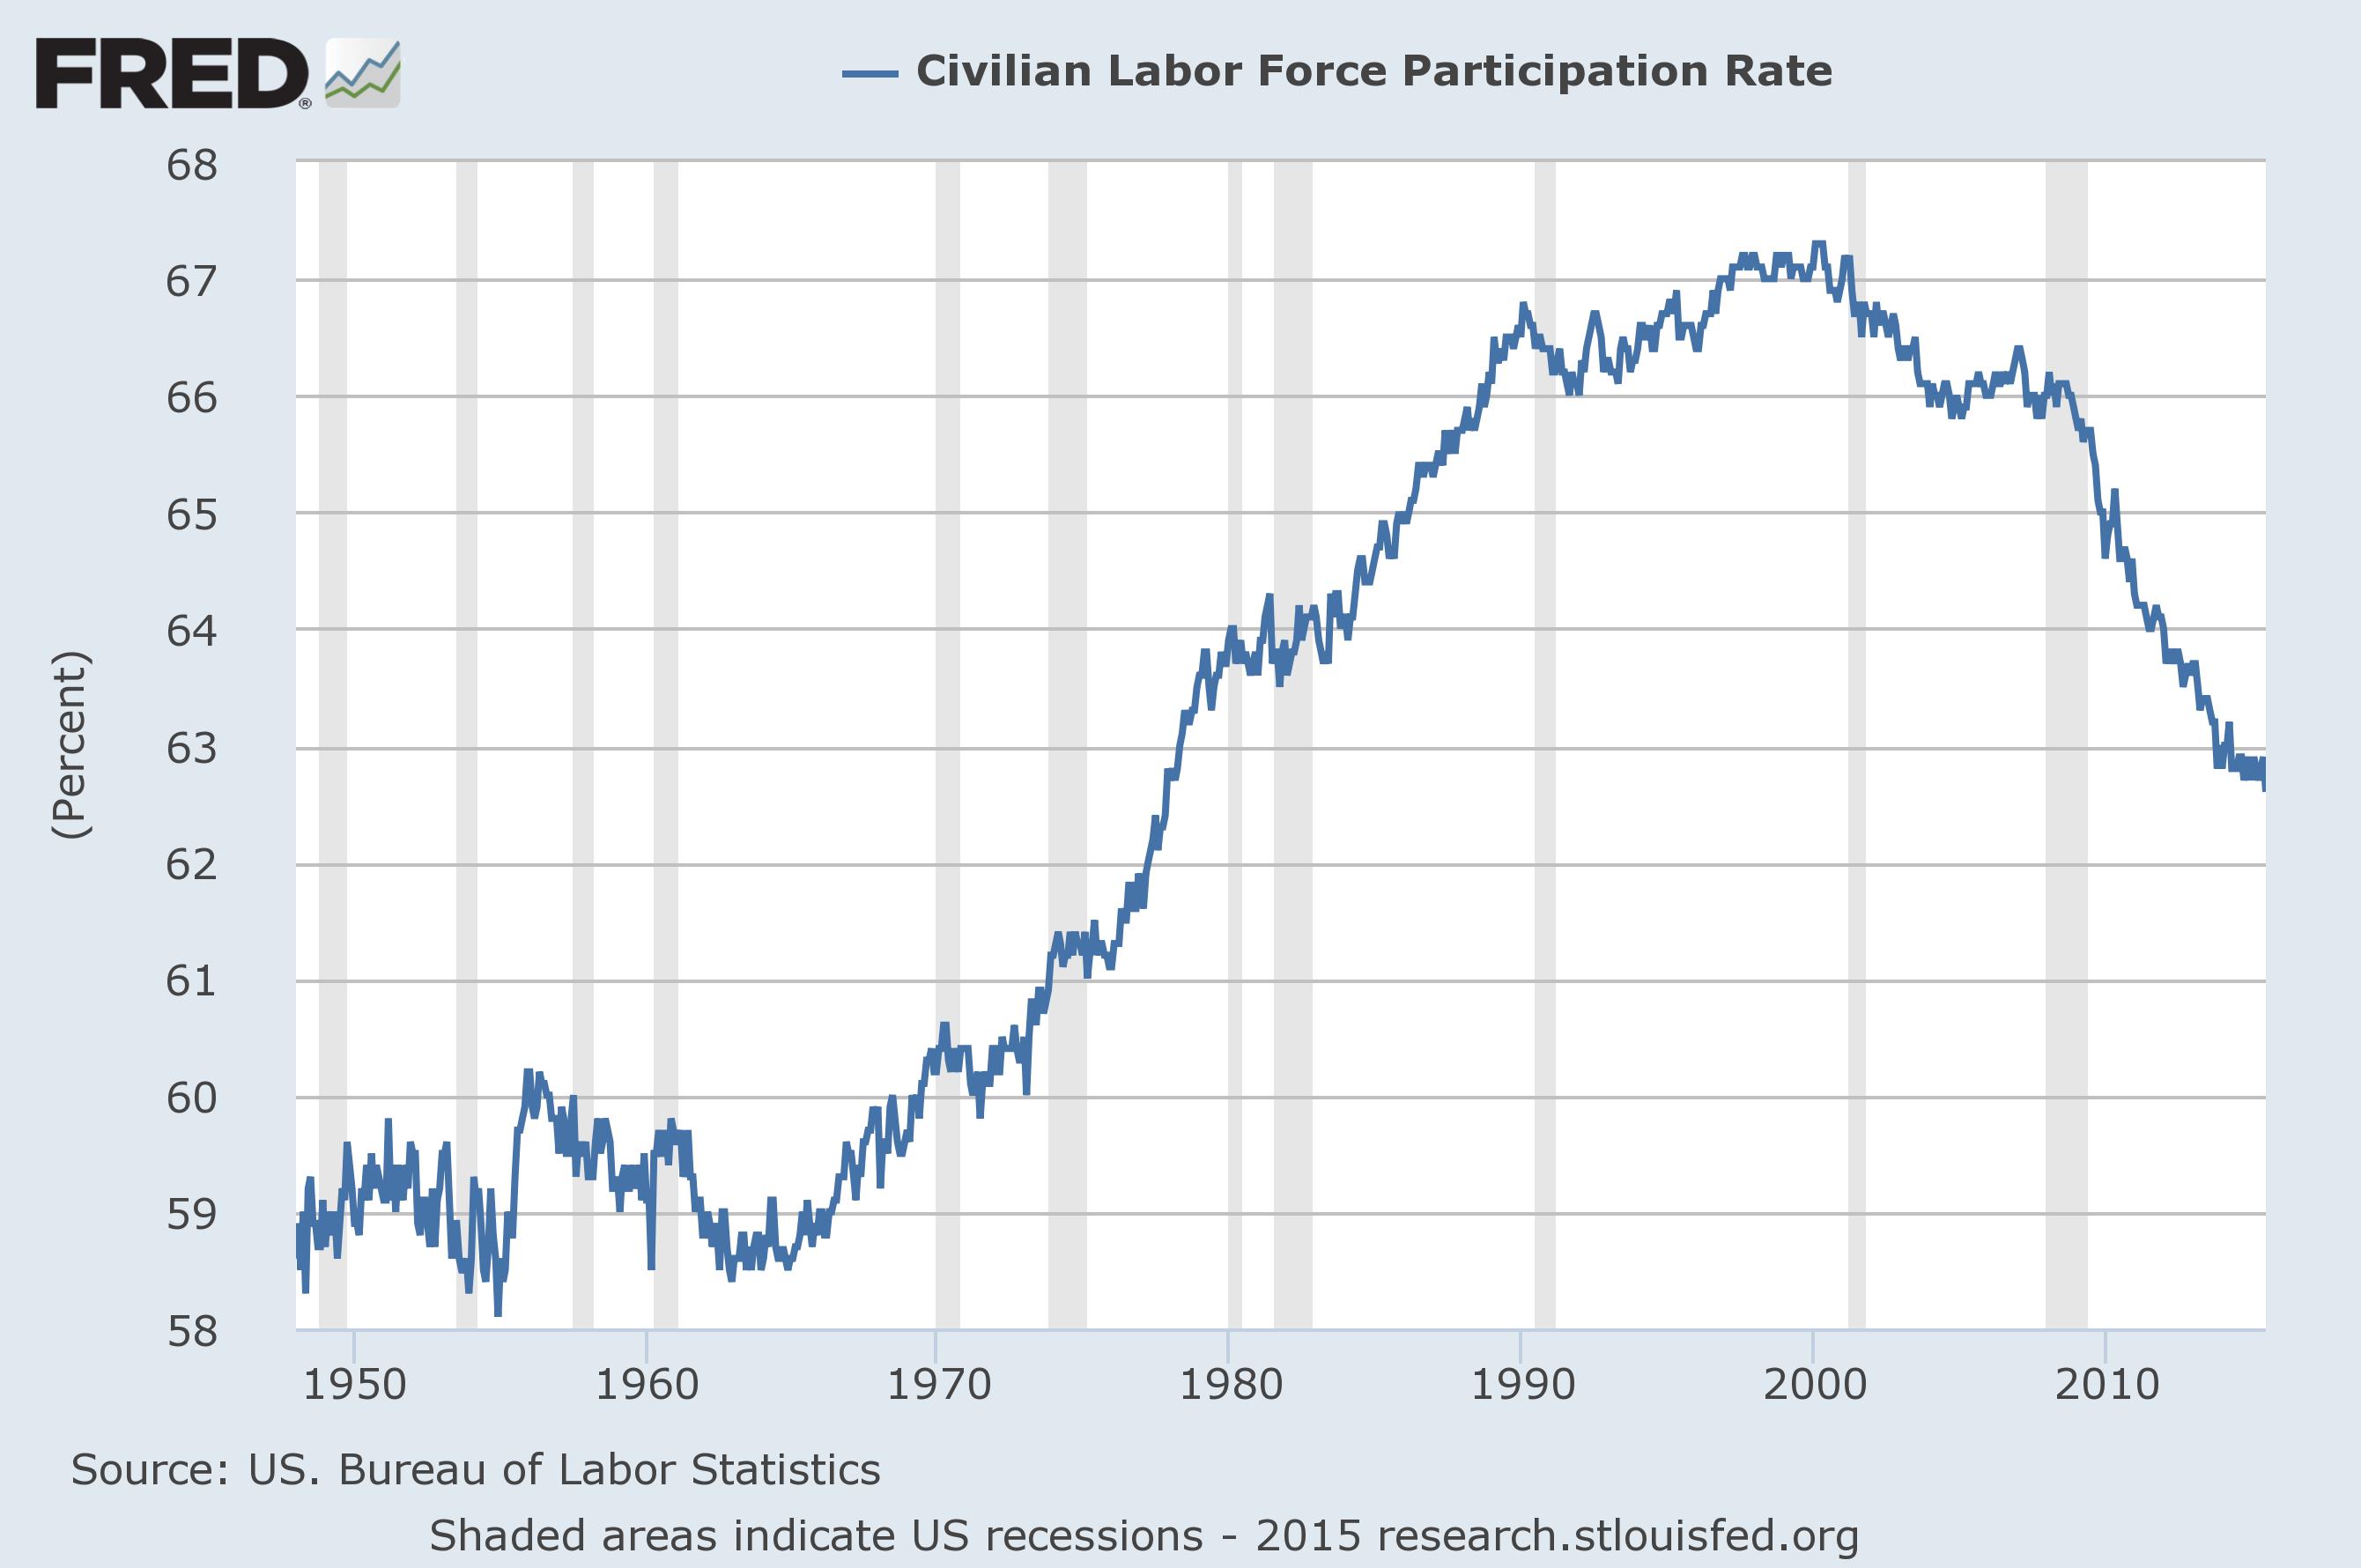
Labor force participation rate since 1947. Data from the St Louis Federal Reserve.
It all peaks at 67% in 2000, but has dropped back to 63% today. The glory days, before 1973, had it never higher than 60% overall. The different? About 6.7M people in the workforce. You can be sure that as Baby Boomers retire we will head down to 60% again – or even lower.
That will be enough to put some serious upward pressure on wages once again and start correcting the problem. A little help from a higher minimum wage will be justified, but the main point is that private enterprise is indeed creating jobs at a good clip and a net shortage of workers is likely just around the corner.

If the retirees who went back to work as greeters at Wal-Mart after their retirement funds were lost in 2007-2010 — IF someone, somewhere, tracks all the 13-22 year olds mowing lawns/minor repair work that gets done that an aging population in a small community can pay some, even if not going/or dreamed of minimum wages – IF – minimum wage can be increased without hurting Small Businesses, who, to my mind, are the leaders in new job creation, IF new tools that allow budding Entrepreneurs to start new business and built up from one-man show to Small Business with employees – Well, then, should be on an upswing over the coming years – across the board – – LOL – – while I love charts to analyze/make sense of trends/data, etc. – I did spend some time in Corporate America where the chart builders are instructed by those higher up the ladder to leave ‘out’ certain data points, because they are ‘outliers’ and not relevant – worked at once place where outliers outdid normalized data – – – LOL
So enjoy your blog and feel free to correct me if you think I’ve missed a vital point to correct my perspective to be more in tune with reality! LOL – – We all, everyone, have our stories – forged in past experience and I’m not immune – AND – juggle so many things, I depend upon folks like you to provide links/charts/info so that I may attempt to keep up with all of the topics that are so dear to my heart – but one day, one lifetime, etc., is not nearly enough to become proficient in All of them! 🙂
A lot has to fall in place, yes. But the pressure will be in the right direction. One thing I am leaving out – more Americans on Social Security. That will be the difference between this trip back to 60% of the population working and the last time. Taxes will have to cover that, but … if wages are higher, it’ll work out. That’s what I’m calling.
🙂 Again, depend upon folks such as yourself to keep up on such things – I learned a long time ago, that nothing is ever easy in an evolved/complex society – to be informed means untold hours researching AND if you have your specialties, but are aware of all the other factors that may/may not impact it, Wellll….
LOL – I don’t ‘do’ sound bites, but I “do!” try to follow best as I can those items that affect me/my community/my customers” – but – nearly worn out, because, to my little relational, ‘everything is connected” mind – so many things feed into the end result – –
I read last year where the “Generalist” was going to come back into ‘vogue’ – OH! how encouraged I was at that news!
Still waiting, and so appreciate folks like you that respond, answer questions and take the time to compile informative posts!
🙂
But look at those huge holes when employment growth was under population. Shame you didn’t go back to 2000 because that was a bigger hole than I expected. We didn’t come close to making it up before the next hole did we?
I just went back to 1960 using the BLS data, which is close enough. The “hole”, as you call it, from 2000 on, got as big as 4.5% of the population from that official recession and never got smaller than 3.23% in 2006. It opened up to 10.75% in 2010 (!!) and is now at 6.12% taking into account all the job loss since 2000.
So if we assume 2000 is nirvana we can say that there is still a net deficit of 6%, which we’re closing
At this rate, we should have full employment by about 2018, so we’re still on the mark for that – unless workers re-enter the workforce and the employment population ratio goes back up. But it shouldn’t with the retirement wave coming.
See this chart: https://research.stlouisfed.org/fred2/graph/?graph_id=249132&category_id=
Some wages go up simply due to tenure in the job. That is a type of conundrum. We ought to remember that some of these people have children to raise. All people who are mothers and fathers understand this and they are unwilling to relinquish their job (if they have had the job for a while) and their annual wage increases–whether real or only nominal. Their step increases in salary allow them to purchase thing they feel they worked hard for. What are things they want to purchase. Vacations. Weddings, Nice clothes. A house. Furniture Organic food. Charitable giving to non profits. Concerts. CDs Video games. Going to Minneapolis theater. See the St Paul chamber orchestra. Workers in the modern world feel unhappy if their salaries don’t increase every year.
There can be enough work to go around if those who have jobs put pressure on the system to lower their wages to create jobs for those without employment.
There will be more work when the money we have out there right now turns over a lot more often. The lack of money among the lowest wage earners has ruined the middle class prosperity of the golden age.
I see the ADP report came in much lower than expected – up 185,000 jobs. Does this change your analysis?
I’m not sure that retiring Baby Boomers will be that big of a wave after all. Unless you are telling me that the population line you have above of 16 to 64 years olds will go negative and the working age population will shrink.
That is low, but we are still way ahead of population growth.
Yes, the population growth will go negative for the chart above by 2018. As it is, job growth is already ahead of the growth in the working age population.
Good that we’re gaining jobs, but something has to change.
It will.
Jack Uldrich predicts the future.
Liked this post. A lot. Encouraging. So many young and gifted thinkers. They will have an opportunity to utilize their talents and gifts. Best piece of news I’ve read in a long time! I’ve always relied on talent to get me through difficult situations. And you know what? It works! Plus I always listen to the kids. They know what’s going on. They don’t lie.
Always listen to the kids! 🙂
Thanks for reading. 🙂
Pingback: Drama Over Yet? | Barataria - The work of Erik Hare
Pingback: Read Their Lips | Barataria - The work of Erik Hare
Pingback: Labor Day 2016 | Barataria - The work of Erik Hare
Pingback: ICE’ing Fresh Produce | Barataria - The work of Erik Hare
Pingback: Labor Day 2018 | Barataria - The work of Erik Hare