
Are you better off now than you were so many years ago? It was a question first raised in the 1980 campaign, a motto used to defeat President Carter. The answer then was a rather sure “No!” and the voters responded, blaming the man in charge. But are you better off now than then? And was it fair to blame Carter or any President for the state of the economy?
A few graphs showing the state of workers in the Postwar Era (1947-today) shows how the problem persists. Sen Sanders has often said that the last 40 years have been a slow retreat for workers, and he has a point. But who is to blame?
Let’s leave blame aside for a moment and check out the numbers first.

Hey, people seemed happy. When was valium invented?
We’re going to rewind the clock back to the glory daze of the 1950s. It was a time when the man of the house worked and many women stayed home to raise the 2.3 kids. Life was good and simple, so the myth goes, and everyone knew their place. More importantly, there was a growing standard of living for everyone regardless of their place in the great industrial machine known as America.
We’re leaving out the need for civil rights for minorities, women, homosexuals, and so many other people. Let’s just talk economy and wallow in the myth for a moment.
The first graph demonstrates there was some truth to that myth – until a turning point where everything changed:
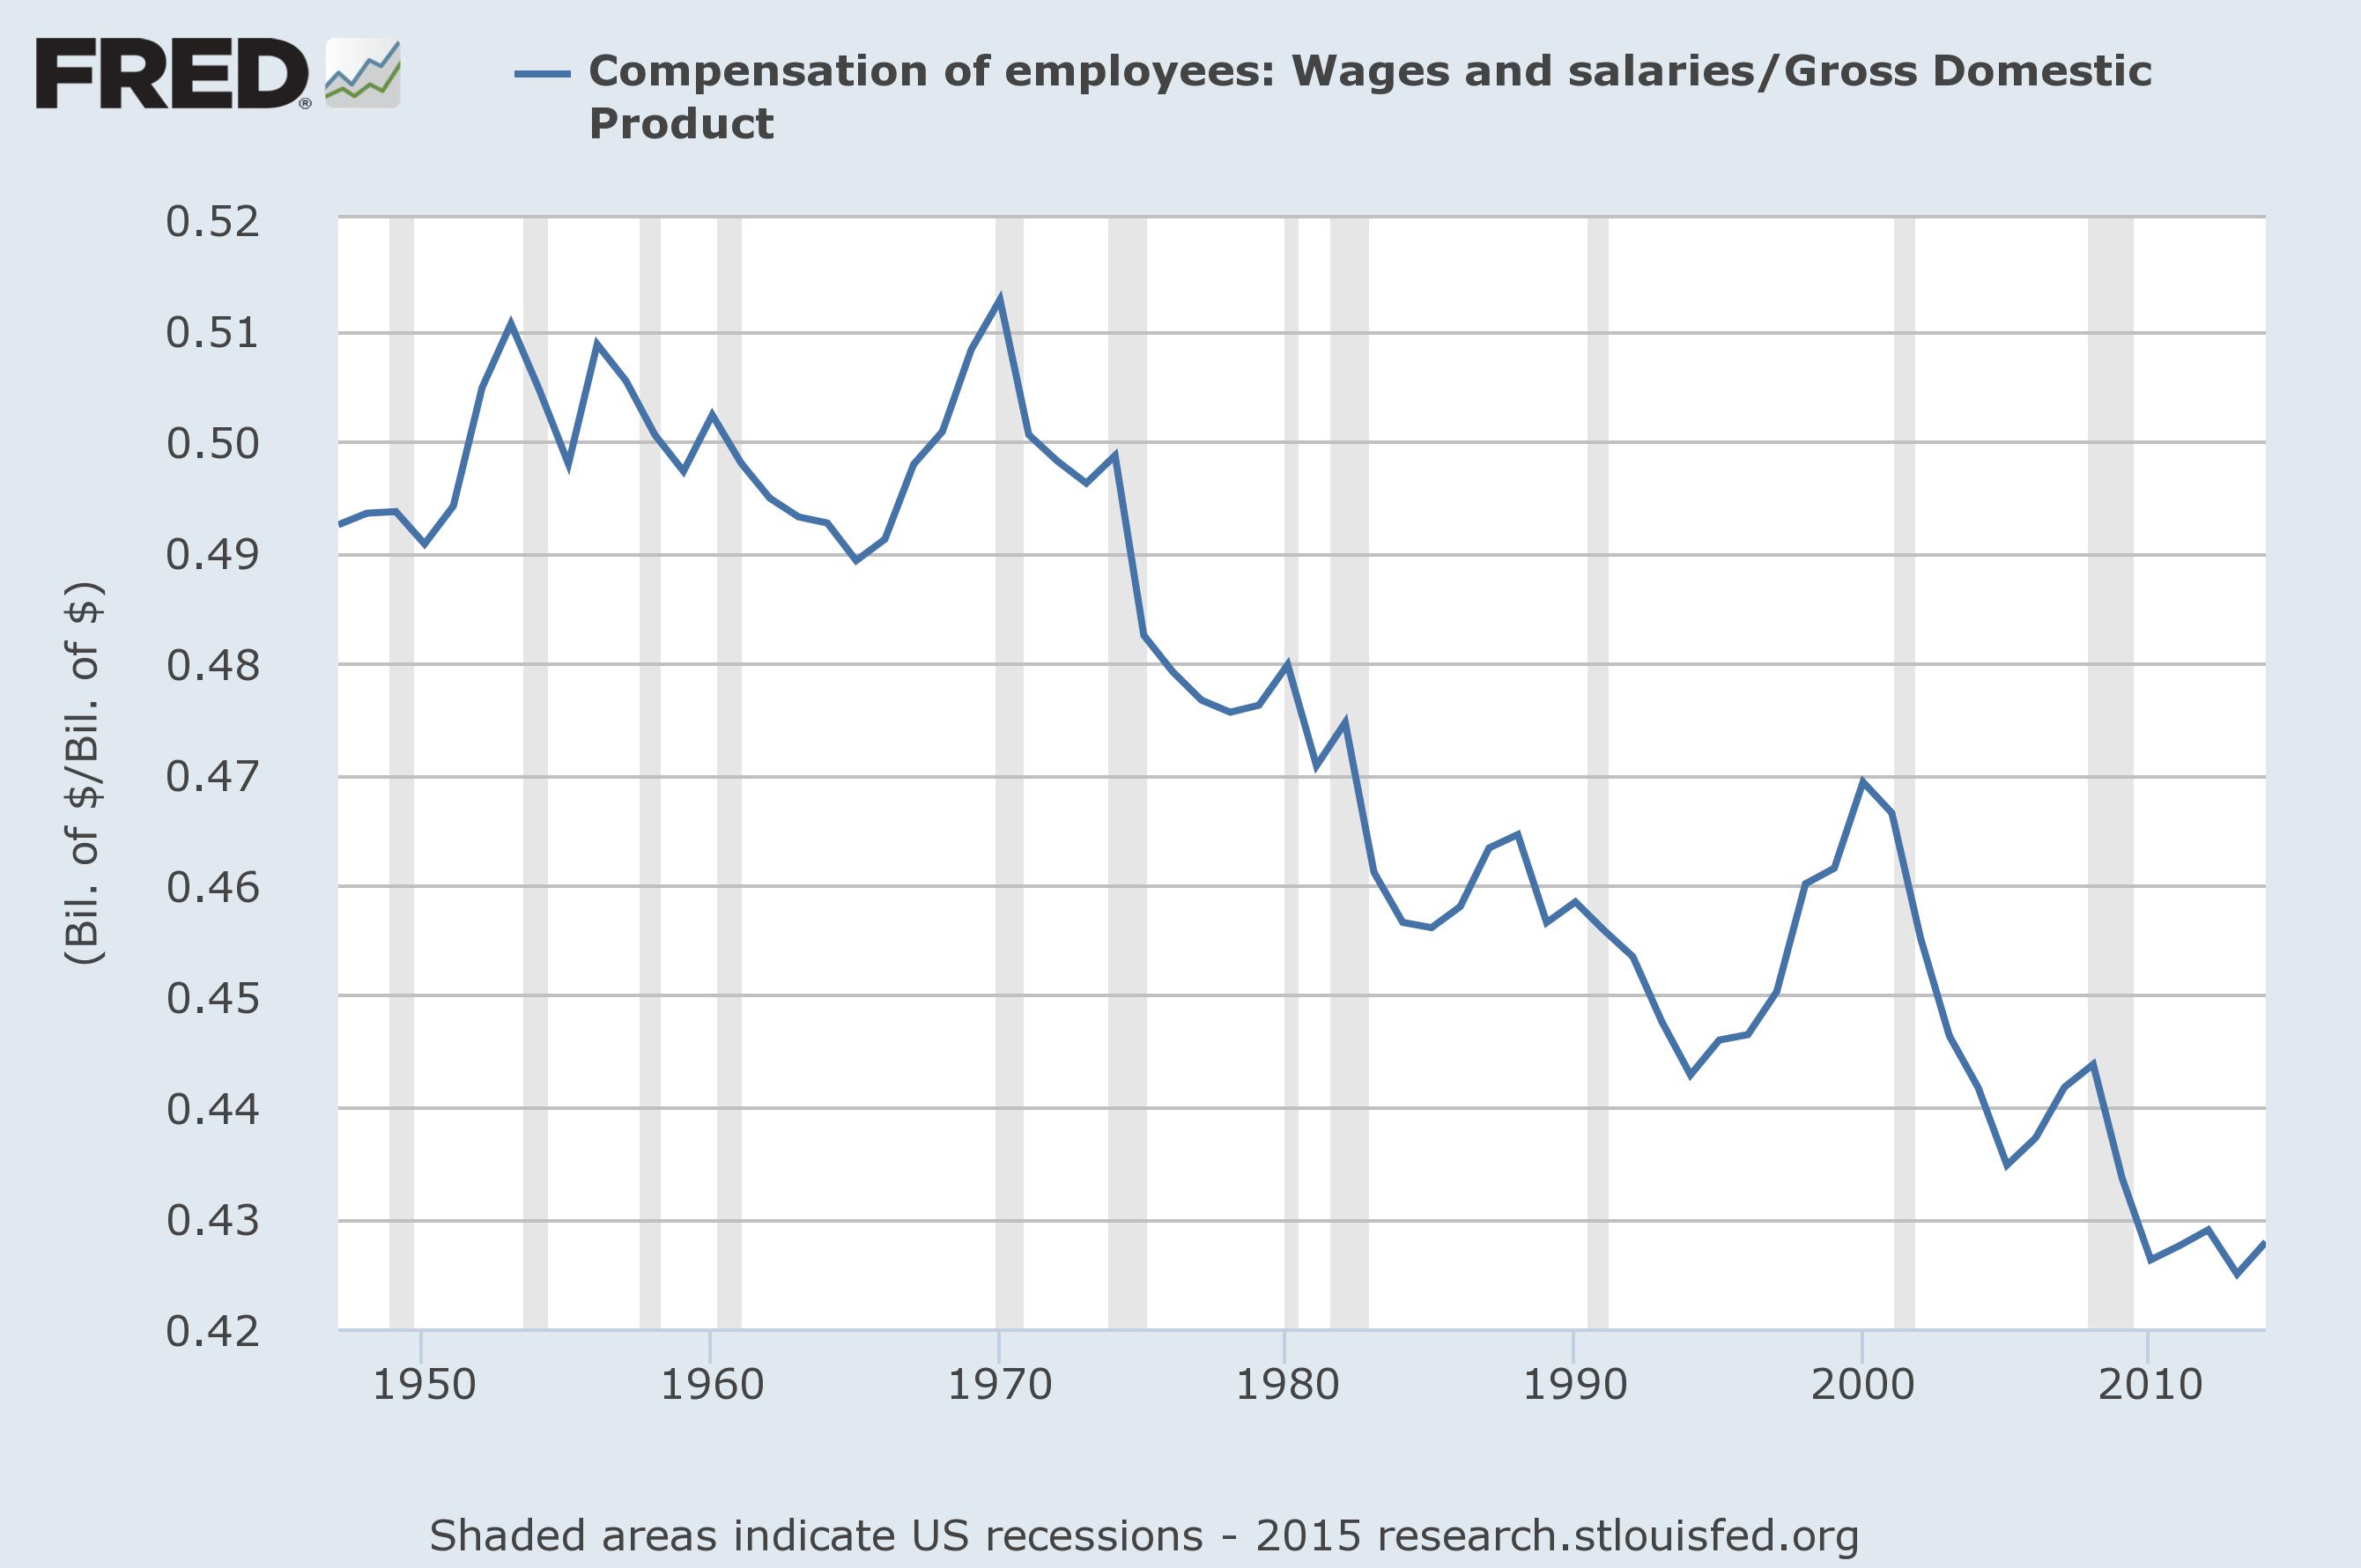
Wages as a share of GDP. Data from the St Louis Federal Reserve.
This is a chart of the total amount paid out as wages as a share of Gross Domestic Product (GDP). From 1947 to 1973 it bounced around a little, but was always about 50%. That was the great social contract that powered the myth. Workers got half of the benefits of the system in the form of wages, investors got the other half.
Something changed, however, and the inflection point hits sharply in 1973. From that point on, save a brief correction in the 1990s, it’s straight downhill to a worker’s share of a bit under 43% today. The difference? If workers still took in half of all wages we’d all be taking home 16% more in pay ( (50-43) / 43 ). Remember that number.
We can look at wages per employee by dividing this wage figure by the total number of employees and adjusting for inflation. There’s a lot of math going into this chart to make the numbers work out in constant 2015 Dollars, but you can see what happened quickly:
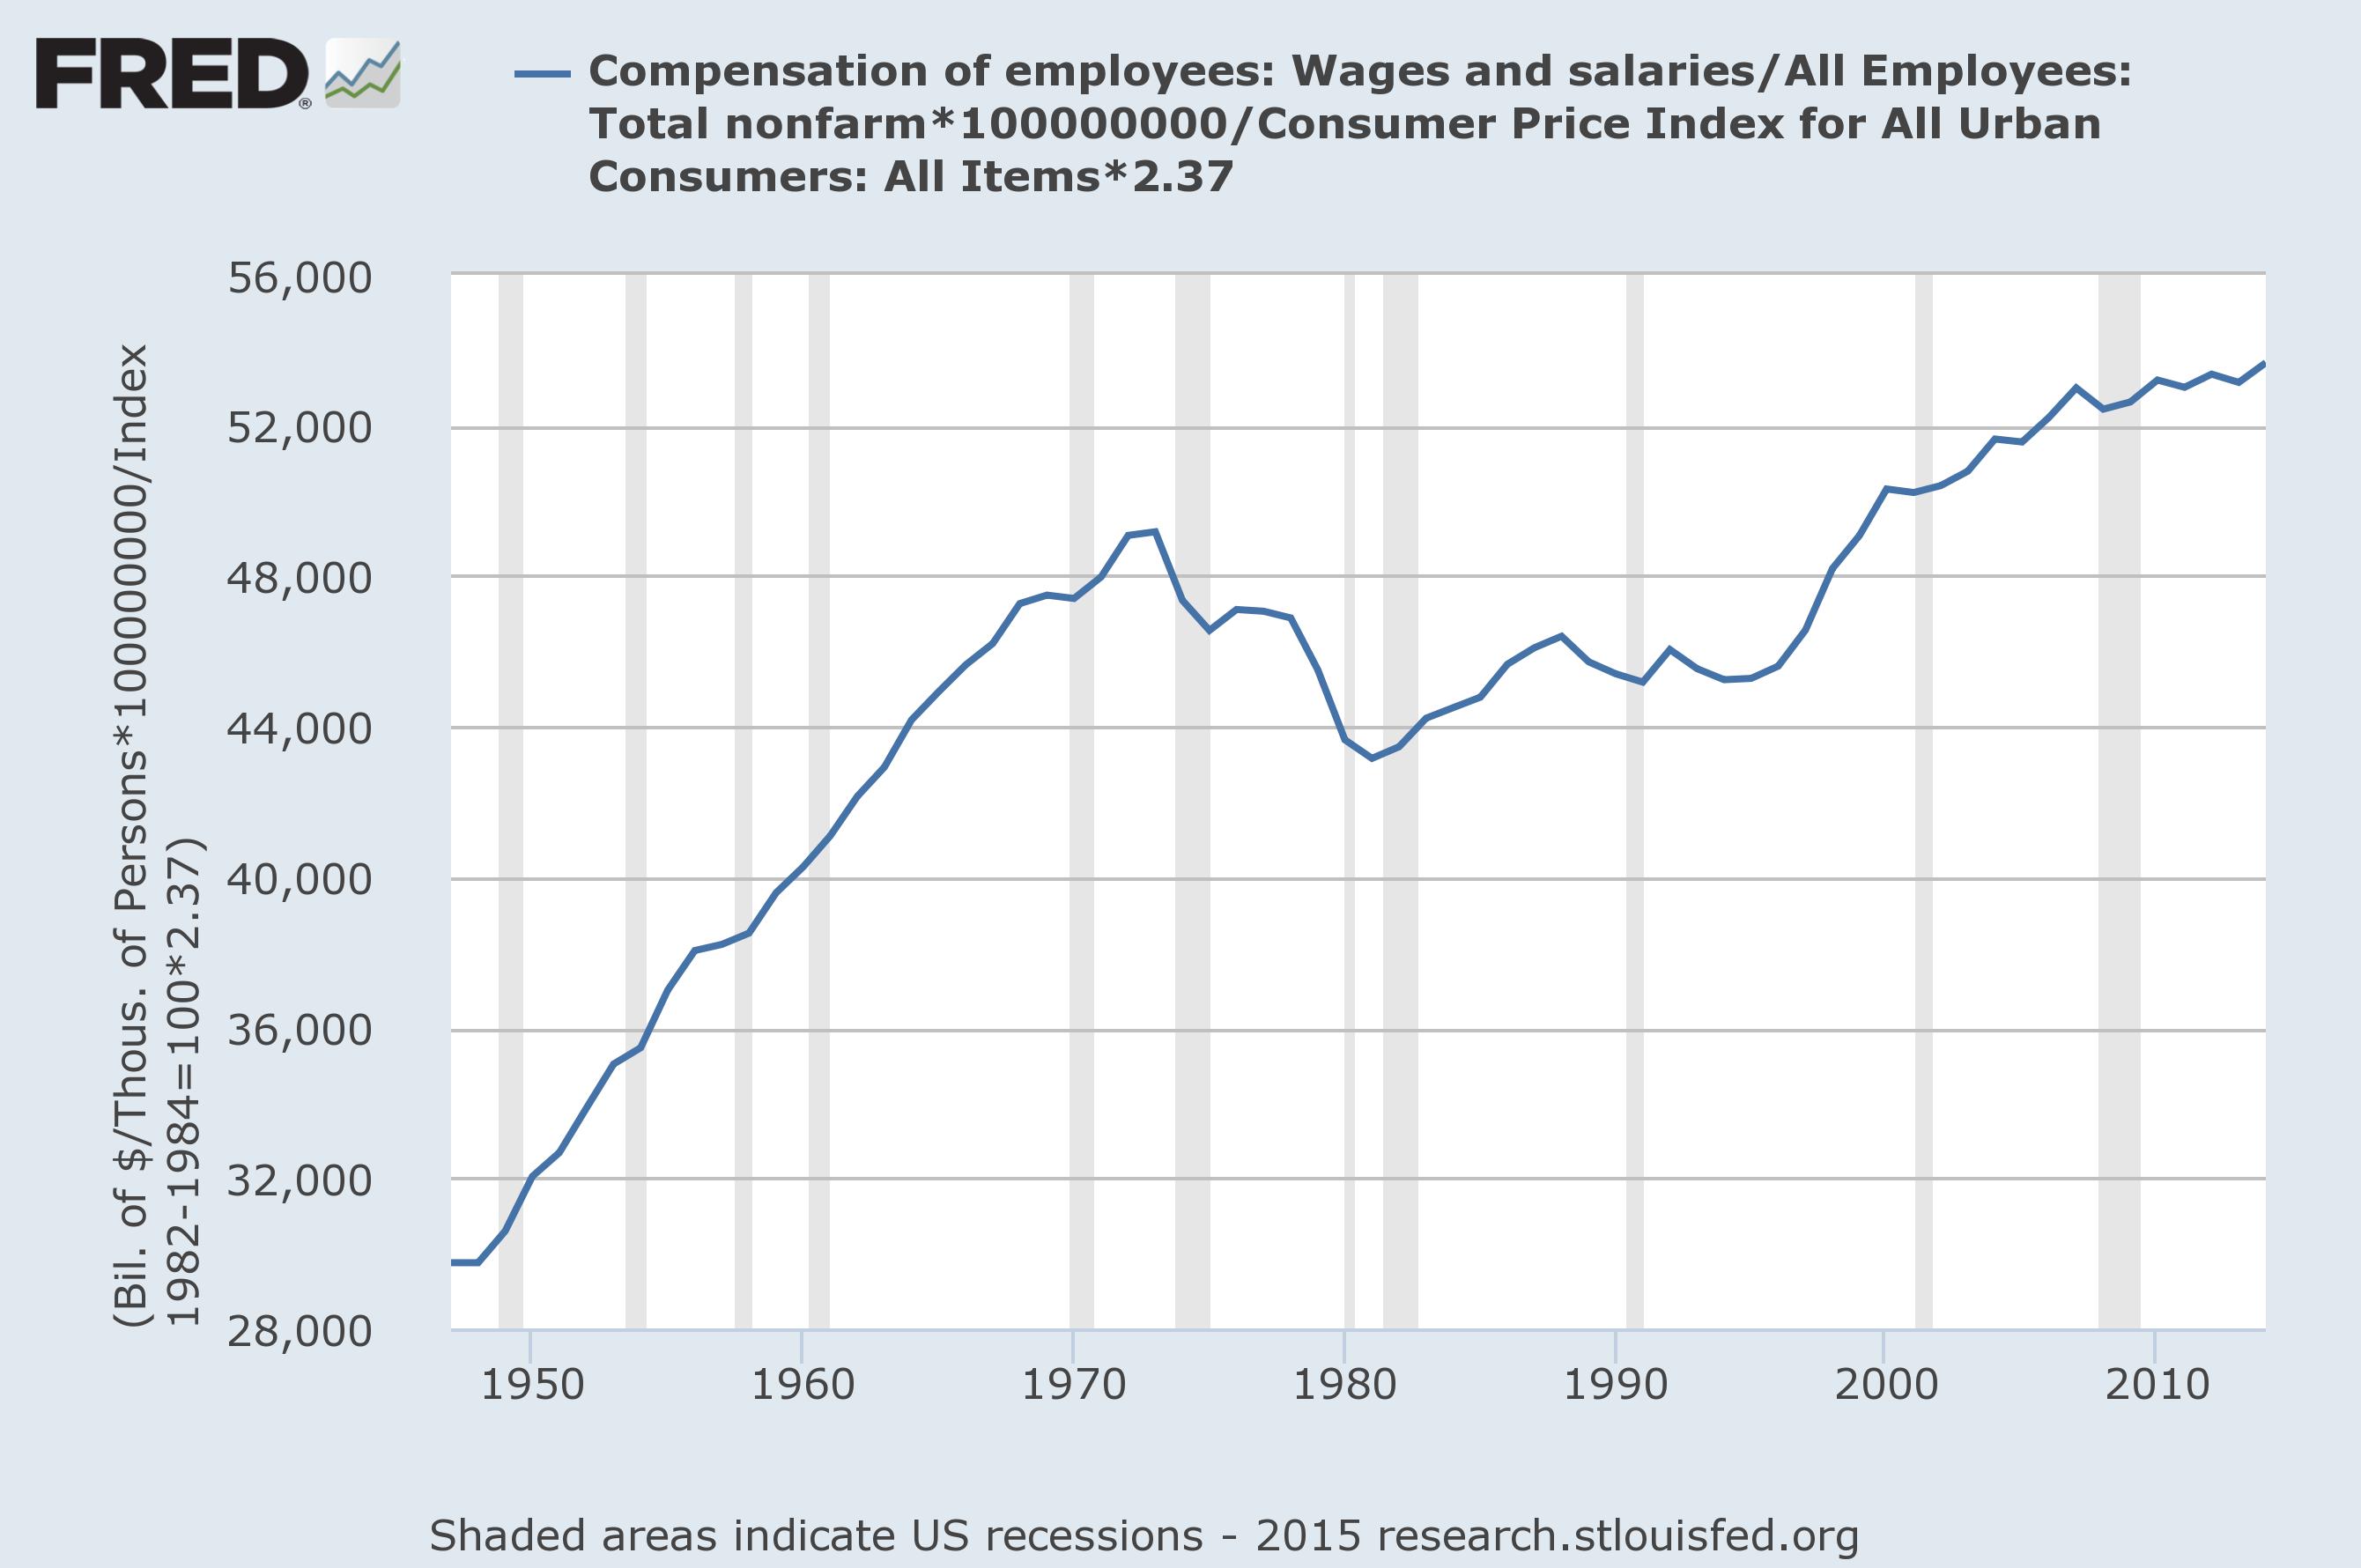
Average (median) pay per worker in constant 2015 Dollars. Data from the St Louis Federal Reserve.
Wages grew dramatically from 1947 until the same inflection point in 1973. From there, it dipped down until about 1983 when they stabilized, not reaching an upward bounce until the 1990s. You can see in this chart why Carter lost, but it’s not as though the Reagan years were a lot better.

There is work to be done.
In this chart, in terms of an average salary of a worker, the upward bounce continues until today. That’s because the total workers as a percent of the population peaked in 2000, meaning there are fewer people employed. As we’ve discussed before, there may not be enough paid work to go around in today’s economy. Too many workers puts downward pressure on wages by supply and demand. It’s worth reviewing on it’s own before we continue, so follow the link.
From 1950 to 1970 real, inflation adjusted wages went up nearly 50%, or $16k in 2015 dollars. If the bounce that started in 1995 had continued until today at the same rate the average pay would be at $62k, not the $53k they are today – a 16% rise. That is the difference between workers getting 50% of GDP and 42%, as shown in the first chart.
But there’s one last chart worth considering, the net productivity chart. That’s a simple matter of real GDP (inflation adjusted) divided by total employees – net output per worker. It’s been on a fairly constant rise for a while, but there was a bump:
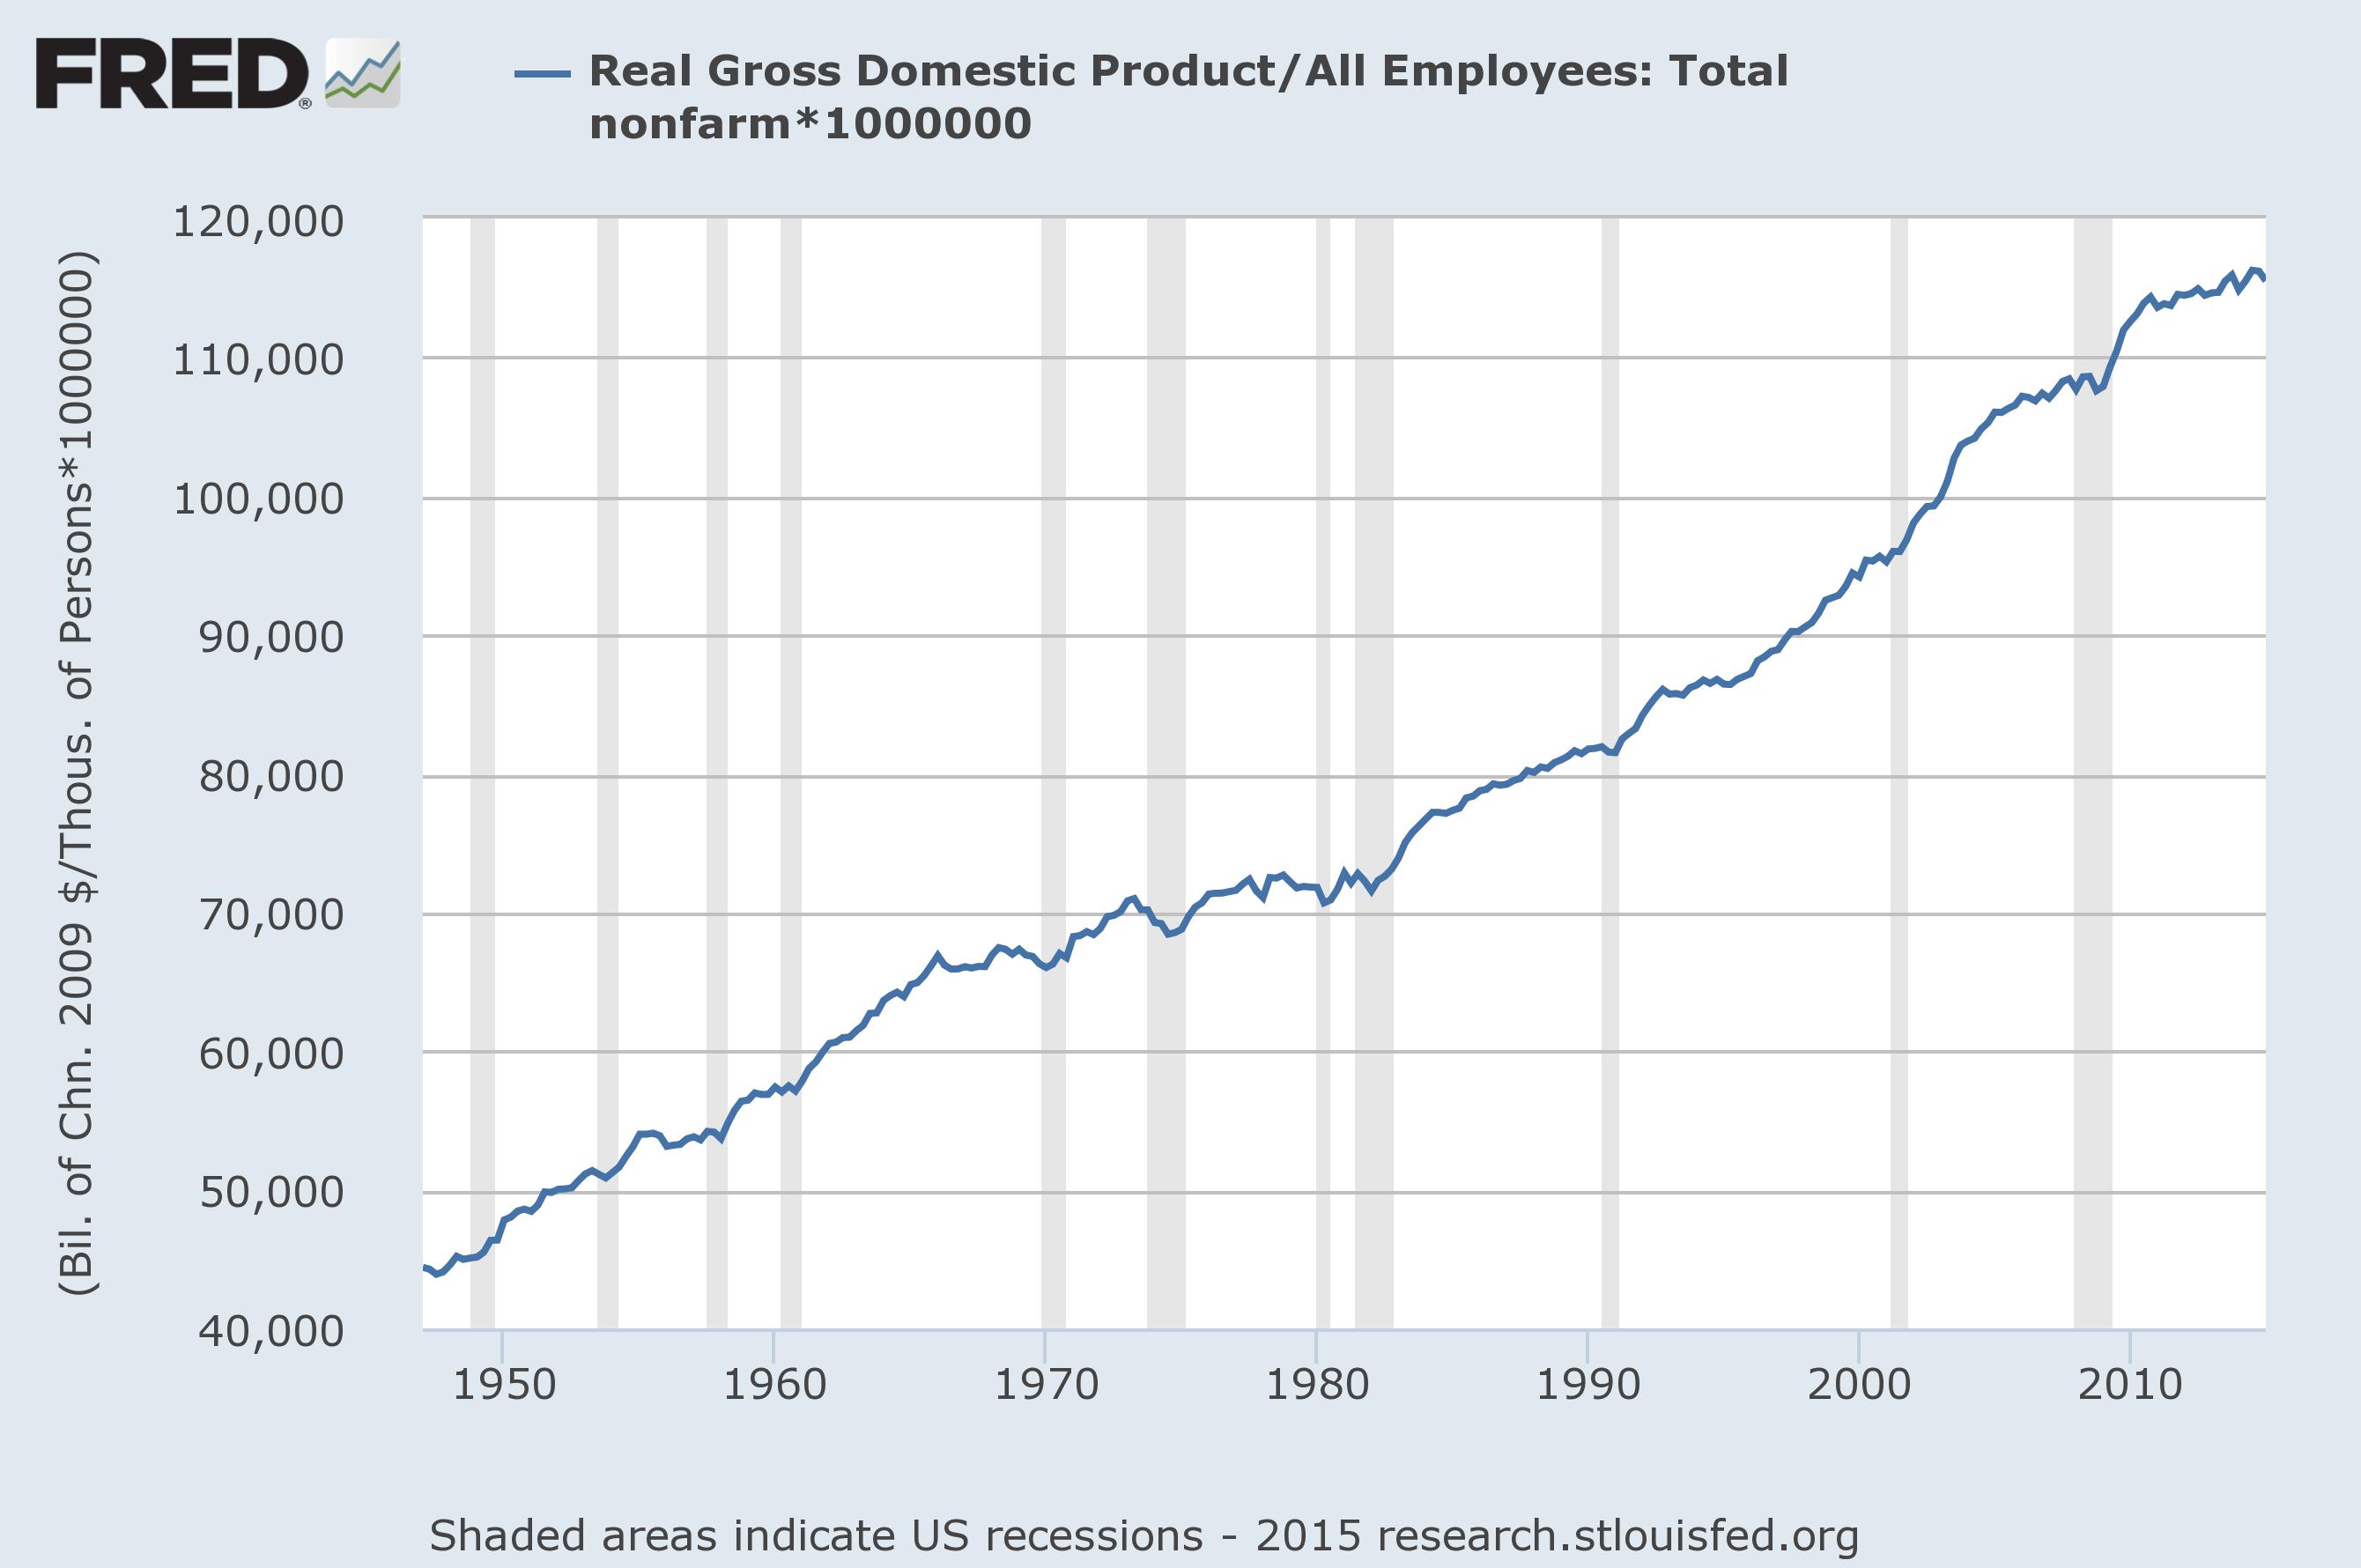
Productivity, defined as real (inflation adjusted) GDP per worker. Data from the St Louis Federal Reserve.
Yes, back to about 1973. It was fairly flat for a while, but productivity has been on a fairly constant upward trajectory since 1947, save a small pause in the 1960s and 1970s that was considerably flatter. Was that the fault of Carter? Or workers?

Sen Bernie Sanders (I-VT)
There’s no point in assigning blame before we all know the numbers, but one thing is clear: Sen Sanders has a point when he says the last 40 years have been a period of decline for working people. What’s interesting is that aside from a pause in the 1970s it hasn’t been a problem with worker output, so you can’t blame the workers for it.
What did change was the basic social contract that workers got, on average, half of all the gains. That stopped in what appears to be an ordinary downturn but never recovered. A real boom in the 1990s helped, and hard times in the 2000s weren’t that hard for people with jobs, but we have only slipped further behind.
Where did things go wrong? It appears that a business cycle that generated a slower rate of productivity starting in 1965 didn’t hit workers hard for about 8 years – but then really hit. Things picked up a bit in the bull market of the 80s, but for workers it still took about 8 years of lag before wages came back.
But from there it gets strange because when that upbeat business cycle ended in 2000 productivity kept rising. Workers who are still employed aren’t exactly taking the hit they did in previous cycles, but fewer people are employed.
What does this mean in the end? Ordinary business cycles explain a lot of what we’ve seen over the last 40 years, at least if you assume an 8 year lag between a change in a market and a change in worker’s wages. But the basic division of the spoils did indeed change 40 years ago and almost came back before 2000 before falling again.
Something has changed, and it’s worth focusing on why. Workers are getting a smaller share of the economy, possibly due to automation and the capital it takes to buy machines dominating the economy today.
Want to blame a president for this? That sounds hard. It seems more like something we have to work on together and not accept easy, pay answers like “It’s all Reagan/Bush’s fault!”

Your eight year time lag should have provided the clue for you. Go back to 1964 and look at political, business, and social events. The other hint or clue is credit creation.
There is no doubt there was a big change around 1964-5 in business cycles. It’s definitely worth looking at credit and how it expanded at that time.
Great post – as I thought over the charts and all the things that, to my mind, also contributed to these falling numbers, I realized again, we live in an ever complex world, and while leaders in both politics, policy and industry can and do make flubs that affect things, I, too, don’t think it is ever a simple matter of pointing fingers – 🙂
Trouble is, it’s hard to fit that many charts, explain them in depth, and go over all the contributing factors (aging work force working longer, technology advancements, rising cost of living that makes it harder for people to retire, lagging minimum wage, etc., etc.) in a 30-60 second sound byte for advertisement – 🙂
It is possible, though, to put the following into a 15 second spot:
“My opponent says he supports workers – here’s what’s happened during his term in office” (go to chart) “He’s a Liar” – LOL
My contention is that a lot of this just happens for reasons that we really cannot explain, at least not while they are happening. It takes years of looking back to realize what mistakes were made and by who. But something very much did change in the 1970s, we can be sure of that.
So much of what I read – both from economists, proponents of local currency systems, sustainability and conspiracy theorists all refer to the changes to the Gold Standard by Nixon in the early 1970s – https://en.wikipedia.org/wiki/Nixon_Shock (General Overview of it)
I find the widespread referral to this moment in history by a wide variety of folks who disagree on so many other angles/perspectives/solutions to be intriguing and while I do not believe it to be The Single Factor – it is something that is referred to by nearly everyone who researches/comments on such things – 🙂
Yes – this was set forward by the same business cycle that started in 1965. There are so many effects from the end of the immediate postwar cycle that it’s hard for me to tease them out, but the abandonment of the Gold Standard and the new global currency regime that came with that is a very important turning point.
In economic cycle terms outlined by Kondratieff, we moved from an economic Spring into a Summer about 1965. That turned to Fall in 1983 and then back to Winter about 2000. Each season has it’s own ups and downs, but we can see the patterns.
This new Spring, which I expect in 2017, will have its own patterns. But what I hope for more than anything is a renewal along the lines of the last one – and a return to what worked so well then.
I can send some links to the theory that 2017 or so is the Year Everything Changes.
Would love to see your links! 🙂
I try to research/keep track of so many different things, that, to my mind, all feed into the same foundational puzzle,
I often fall behind on keeping up to date on all corresponding factors (if I would just consign my interests/beliefs to one thing, I could keep up better – i.e. blaming an American politician/political party for everything – LOL- 🙂
Thank you so ever much! I so enjoy your articles, links, etc. and appreciate access to a like minded individual regarding “It’s not that simple – here’s the facts” , that helps me to keep up on changing variables! 🙂
It’s a complex/complicated world anymore and I, just last week, finally gave up on my internal belief that I might, with due diligence, keep abreast of every single variable that feeds into overall wholes/landscapes of every topic dear to my heart.
Please know how much I appreciate your perspective and willingness to share info – I walked away from major media outlets/news feeds so very long ago, but still don’t always have alternate sources to point me in the right direction, with linked footnotes, to research every topic I wish to know more about! 🙂
The curse of a Generalist soul in an Expert culture – – 🙂
People seem numb to stagnation although you are showing it was worse than it is today. Perhaps our expectations are just really low but I get the feeling people with jobs are just happy to have work most of the time.
Agreed. It’s a bit better than it was and that seems to be keeping people from outright rioting. The gains of the 1990s were really good, but not good enough – and they haven’t continued in the numbers necessary to sustain another rise. That will take the Boomers retiring among other things.
Is your contention that a 50/50 split the ideal? What if workers had a larger share, for example? Is it bigger or smaller in other countries?
Empirically it seems to be a good balance, yes. Would more be better? I’ll look up Germany and a few other places that seem to be highly equitable. Germany seems to sustain a higher level of employment than most nations, for one, which is interesting.
Eric, you speculate “possibly due to automation”. Can there be any doubt! Automation in all of it’s forms has replaced many skilled worker pay categories. Fewer skilled with higher pay has hollowed out a great middle class of earners. This will continue until we figure out how to put them back to work at higher earning jobs. It’s hard to justify a lot of training expense when employment loyalty has broken down on both sides and we are stuck with a part time economy.
OK, automation is definitely part of it. The reason I was hedging is that I know it’s not all of what’s going on. A higher percent of the economy in finance, for example, has higher output per employee than manufacturing.
My definition of automation would be more broadly construed to include all finance sectors, publishing, building technologies such as BAM imaging, all of the vertically integrated industries that are now able to bypass traditional steps in the process eliminating good paying for instance warehouse jobs or at least the leverage to make them such. I could go on and on with smart technologies and the efficiencies that have followed. We now need an economic reasons to invest resources into our human capitol instead. By the way, human capitol does have some responsibility here, in that it should come to the table trained and ready to contribute. Now that is complicated. Perhaps, and unfortunately, why financial forces prefer to invest elsewhere.
On automation, I think we generally agree. Although, as I’ve often said, today’s productivity gains are tomorrow’s unemployment.
As for the potential “skills gap”, there is evidence that there is such a thing but it can all be explained by other things. I happen to believe that it’s real if for no other reason than we live in a rapidly changing economy (and really have since the 1970s, more or less) which will always have problems like that.
Hit the nail on the head. Working people have been screwed for a long time & theres plenty of blame to go around.
Yes, that’s pretty much it. 🙂
Given that you didn’t work women, minorities and gays back into the picture, this blog is the most racist, sexist and homophobic thing I have ever read in my life.
Figures since you are white, male and straight. You, sir, are one of the elite. Shame on you.
Yes, I’m one of the elite as a pale male. But there’s still always room for raw numbers, not people. They tell stories on their own if you let them talk.
Postscript – Looking at the last graph, I think I can say that there are indeed important inflection points in 1965 and 1982. GDP per worker, which is to say “productivity”, increased from $45k to $67k between 1947 and 1965, or $1.2k per year. From 1965 to 1982 it only increased $0.5k per year. After that, it returned to $1.3k per year where it has been ever since, more or less.
The inflection points in 1965 and 1982 are important because we know they are business cycles. They are the start of the economic Summer and Fall, to use Kondratieff terms. But what about the big cycle, changing to Winter in 2000? Productivity growth did not fall largely because though GDP isn’t rising as quickly there are also fewer workers.
This may be a feature of Depressions, and sadly we don’t have this kind of data going back to about 1900. But it makes some sense to me, as this high rate of productivity keeps a lid on inflation and really sets up the Spring that we know is due around 2017.
So what happens if we keep this productivity gain rate and hire more people? Prosperity for all! But what if we keep it and redistribute wealth differently – which is to say go back to one wage earner per family, cut hours, etc?
A few things to read on the topic:
The Year Everything Changes: https://erikhare.com/2013/11/20/the-year-everything-changes/
Forward! 2015 & Beyond: https://erikhare.com/2015/01/14/forward-into-2015-and-beyond/
And this interesting piece in the Washington Post on Bernie Sanders – more equity, even if it means less growth: http://www.washingtonpost.com/blogs/wonkblog/wp/2015/07/13/what-bernie-sanders-is-willing-to-sacrifice-for-a-more-equal-society/
My take, in the end? We don’t have a problem with productivity growth, but we clearly have a problem with inadequate demand for the products we are producing. We either need more demand, fueled by more money in the hands of the working and poor (or perhaps more open trade with the rest of the world?) or we need to accept lower growth.
Either way, I believe greater equity HAS to be in the cards by the time 2020 rolls around. Either we work to master it or the market will do it for us. “Tax profits, not labor!” remains a starting point for me as a way to create more jobs, but a shorter work week may be necessary as well.
Consider this a lead-in to what I write next. 🙂
Another reason you are one of the elite is that you are wealthy. Much of what you say is therefore more aimed at Wall Street rather than Main Street.
First time I’ve been accused of being wealthy. Can I just say that it would be nice, or so it seems?
We should remember that people who write blogs on intellectual subjects have to be intellectual elites. They are attempting to sway public opinion.
A wealthy person is just someone who has had a positive net worth for a long time.
Some of your analyses are just too clinical. Readers should just ask themselves: what is rich?
I like to use the Highland Park neighborhood in St. Paul as an example. But who are those people living there? They are successful professionals, right? Are there working class people who live there? I assume that is possible? What working class professions earn a lot? Can a single parent with 2 children working minimun wage live there? No.
Household debt and negative net worth are reasonable indicators of scraping by. One wouldn’t just look at income since we know a lot of Americans tend to have bought too much, whether that is house, education or consumer things.
Pingback: Tax Profits, Not Labor! | Barataria - The work of Erik Hare
Pingback: Bear or Bull? | Barataria - The work of Erik Hare
Pingback: Crisis and Calm | Barataria - The work of Erik Hare
Pingback: End “Quarterly Capitalism”! | Barataria - The work of Erik Hare
Pingback: Fight for $15 | Barataria - The work of Erik Hare
Pingback: Growth is … ? | Barataria - The work of Erik Hare
Pingback: Demographics is Still Destiny | Barataria - The work of Erik Hare
Pingback: A Critical Weekend | Barataria - The work of Erik Hare
Pingback: Too Much Credit? | Barataria - The work of Erik Hare
Pingback: Trade Deals – Bad Deals? | Barataria - The work of Erik Hare
Pingback: Automation – For People? | Barataria - The work of Erik Hare
Pingback: Progress and History | Barataria - The work of Erik Hare
Pingback: The Future of Work | Barataria - The work of Erik Hare
Pingback: Labor Day 2016 | Barataria - The work of Erik Hare
Pingback: No Credit / Bad Credit | Barataria - The work of Erik Hare
Pingback: Unlimited Credit | Barataria - The work of Erik Hare
Pingback: Labor Day 2018 | Barataria - The work of Erik Hare