Income inequality is certainly the rallying issue for many progressives these days. Paul Krugman goes as far as to call it the one issue, the only important one. “Inequality is, indeed, the defining challenge of our time. Will we do anything to meet that challenge?” he asked last December.
Whether or not that is overstating the issue, the debate over inequality is not going away soon. Solutions are often elusive, largely because the root of income inequality is far from obvious. The free market system in the US has not always had high levels of inequality, after all. It’s a new feature to anyone who lived through the 1950s, for example.
What caused the problem? Perhaps it is the simple law of supply and demand meeting a limit to the paying work available in a developed economy.
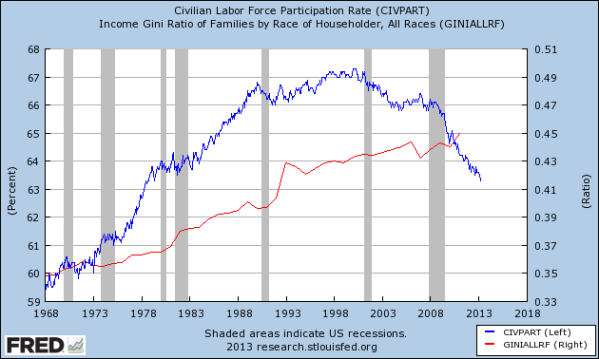
Progressives usually trace it back to policy from Republican administrations, but it seems to go back much further than anyone realizes. The following graph is from the Federal Reserve of St Louis:
The line in red charts the Gini index (right scale), a measure of inequality. A Gini of 0.0 is perfect income equality — everyone earns the same pay, and a Gini of 1.0 is perfect inequality or one person earns everything. It’s a statistical and technical measure that allows easy comparisons across time and nations. It’s plotted with workforce participation in blue (left scale) as a percentage of people over 16 years old who have a job.
Note that both lines take off in 1968, the year that the Baby Boomers, born 1947-1964, entered the workforce in large numbers. While the Gini numbers don’t go back much further, we do know that from 1948-1968 the workforce participation rate never exceeded 60 percent. In the 1970s and 1980s the workforce was young and hungry, looking for work wherever they could find it.
While we can trace the growth of income inequality back to 1968, the reason may not be obvious. But as more people are looking for jobs the competition for every opening is more intense, and those with jobs can be replaced easily. One strong possibility is that an expanding workforce placed downward pressure on wages for working people constantly over 30 years.
Since 2000, however, the workforce participation rate has fallen. The St Louis Federal Reserve has published a paper predicting the workforce participation rate will be under 60 percent by the early 2020s as Baby Boomers start to retire. Yet there is still not upward pressure on wages – at least not yet. Rapid productivity gains made many jobs redundant, and even before the wave of retirement started hitting some people gave up looking for work – going to school, staying home to raise the kids, or simply living in terrible poverty.
This is an important point because even at today’s 63 percent workforce participation the total number of jobs needed above the post WWI 60 percent is 4.6 million jobs in a workforce of over 153 million. It would mean an unemployment rate of under 4 percent.
The difference becomes even more stark when you look across nations. Below is a chart of some of the largest economies in the world in 2012, both developed and developing. Data on workforce participation from the World Bank and Gini Indices from the OECD:
| Labor Force Participation | Gini | |
| Italy | 49 | 33.7 |
| France | 56 | 32.7 |
| India | 56 | 36.8 |
| Japan | 59 | 37.6 |
| Germany | 60 | 27 |
| S Korea | 61 | 41.9 |
| UK | 62 | 40 |
| US | 63 | 45.1 |
| Russia | 64 | 41.7 |
| Australia | 65 | 46.8 |
| Canada | 66 | 44.1 |
| Brazil | 70 | 51.9 |
| China | 71 | 47.4 |
Note that developed nations generally have lower workforce participation rates, many of them 60 percent or lower. And generally there is a correlation between a lower workforce participation and a lower Gini index, meaning that fewer workers chasing after the jobs that are available results in high wages for working people.
In other words, it appears that income inequality is largely a function of supply and demand for workers, and that in a highly productive developed economy there are only enough jobs to reasonably employ around 60 percent of the available workers without downward pressure on wages and rising income inequality.
That conclusion is certainly disturbing, but it is logical. Most of the jobs in the developed world are not manual labor but are highly productive specialty skills with computers and machines. There is only so much demand for the incredible amount any given worker can produce no matter how voracious consumers are.
That implies that there is a reasonable cap on how many people can have such jobs at a decent, living wage.
What then is the solution? We are about to find out what happens to a nation where much of the population is living off of Social Security and savings. The simple fact may be that with only so much work to go around either the hours per worker should be reduced or a greater reliance on public assistance of some kind is natural.
No matter what, the roots of income inequality go back much further than people realize. Some of the problem may correct itself as the Baby Boomers age, but the implications for why that could work out are vast and challenge the basis of our entire economic system.
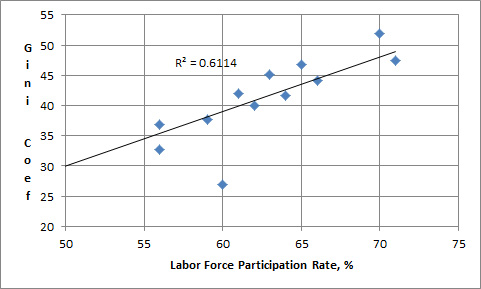
Addendum: In response to a comment, I am including this chart of the data – blown up by not having the axis cross zero like they should. The R2 is 61%, which is not a bad correlation – but far from perfect.


There is always work to be done fixing roads, teaching, and more things than I can name. But if people aren’t willing to pay for them then there is only so much to go around. I sort of see your point but this is disturbing.
But how much of that work are people willing to pay for? In the old days, women tended to stay home – and many did a lot of volunteer work. There’s no reason men can’t do that, too, but we’re not set up for that. Before 1968 the labor force participation rate never crossed 60% – and things were running pretty well. Interesting?
Gone are the days of having a genie coefficent. Much easier back then in the 60s.
I seem to remember from my mis-spent childhood in front of a teevee that Jeanie created more trouble than she solved, so I dunno …
I don’t buy it. There’s plenty of work to go around. Maybe people don’t want to pay for what needs to be done but this doesn’t make sense.
Could you make the table into some kind of graph? I could see it better that way. Thanks.
I will try to put the graph I created on the bottom, but the R-Squared is 61% – not a bad correlation, but not great. I think there is something to this.
I call BS. If big public works or whatever can t be paid for with taxes its because government is inefficient and people don’t trust it with their money. Maybe Germany is the exception for whatever reason but you may have a table of how much people don’t trust government. .
You have a point, but I’d hate to take it to its logical conclusion. Germany is an interesting exception, but I think it’s more about social pressure on high-power executives to not take a lot of money than anything else.
I am missing a couple of things here. The developed nations/labor participation rate. Perhaps I have a freaky love for Canada, living so close to it and all, but I’m having a really hard time thinking of Canada as less developed than every other country in your table than China and Brazil.
And this I also take issue with: “Most of the jobs in the developed world are not manual labor but are highly productive specialty skills with computers and machines.” In MInnesota, most of the jobs available don’t require anything more than a high school diploma or GED. The highly paid jobs require highly productive specialty skills (perhaps), but they represent a smaller portion of the jobs available.
That said, I totally agree with your conclusion. We have far too many people working way too much.
There’s no judgment about who is more developed here, and Canada is always listed as a developed nation. Some of the developed nations have very high labor force participation (US, Australia) and some rather low (Japan). I grouped together the largest economies in the world, which includes both developed and developing – with no call as to who is who.
Yes, we do have a lot of unskilled jobs, as you’ve shown. Calling “most” work skilled might well be pushing it. I have been meaning to look at how the mix in the open jobs compares to the mix in filled jobs.
But, yes, more workers only digs the hole deeper after a while. And 60% LFP is around the right answer, at least with a 40 hour workweek. Interesting.
Hasn’t technology and being able to produce more with less? Even a decade ago I would have needed too hire an assistant but technology enables me to do more with less. As for the rest of what you are saying i felt it acutely being on the younger end of the baby boom. my entire life it has seemed like I waited in line and everything was gone or really picked over by the time I got there. 🙂
Exactly. This is the flipside of “productivity gains”, which is a fancy term for less work to go around. 🙂 I’m a Gen-Xer, so for me even moreso on how things are picked over!
Pingback: What Is The Real Unemployment Rate?
Pingback: The Decline of WorkBig Online News | Big Online News
Pingback: Forward! 2015 & Beyond | Barataria - The work of Erik Hare
Pingback: Redefining Work | Barataria - The work of Erik Hare
Pingback: A New Generation’s Time | Barataria - The work of Erik Hare
Pingback: Broken Social Contract | Barataria - The work of Erik Hare
Pingback: Tax Profits, Not Labor! | Barataria - The work of Erik Hare
Pingback: Fight for $15 | Barataria - The work of Erik Hare
Pingback: About this EU Thing … | Barataria - The work of Erik Hare
Pingback: Labor Day 2016 | Barataria - The work of Erik Hare
Pingback: Labor Day 2018 | Barataria - The work of Erik Hare
Pingback: Work For All? | Barataria - The work of Erik Hare
Pingback: Work Redefined | Barataria - The work of Erik Hare
Pingback: The Broken Social Contract | Barataria - The work of Erik Hare